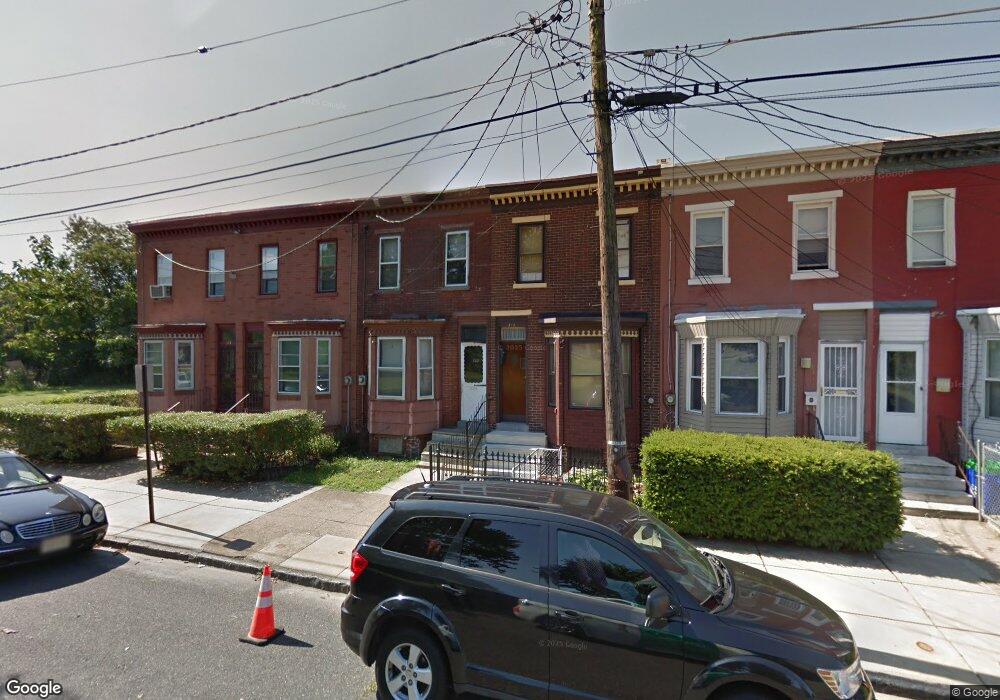
318 Berkley St Camden, NJ 08103
Lanning Square NeighborhoodEstimated Value: $99,488 - $196,000
--
Bed
--
Bath
1,147
Sq Ft
$122/Sq Ft
Est. Value
About This Home
This home is located at 318 Berkley St, Camden, NJ 08103 and is currently estimated at $139,872, approximately $121 per square foot. 318 Berkley St is a home located in Camden County with nearby schools including Camden High School, Hope Community Charter School, and Leap Academy University Charter School.
Ownership History
Date
Name
Owned For
Owner Type
Purchase Details
Closed on
May 5, 2023
Sold by
Cannon Carol
Bought by
Jenkins Alethia
Current Estimated Value
Home Financials for this Owner
Home Financials are based on the most recent Mortgage that was taken out on this home.
Original Mortgage
$88,369
Outstanding Balance
$85,930
Interest Rate
6.43%
Mortgage Type
FHA
Estimated Equity
$53,942
Purchase Details
Closed on
Mar 2, 2022
Sold by
Perno Joseph Peter and Disibio Joseph A
Bought by
Cannon Carol
Purchase Details
Closed on
Feb 17, 1988
Bought by
Perno Joseph Peter
Create a Home Valuation Report for This Property
The Home Valuation Report is an in-depth analysis detailing your home's value as well as a comparison with similar homes in the area
Home Values in the Area
Average Home Value in this Area
Purchase History
| Date | Buyer | Sale Price | Title Company |
|---|---|---|---|
| Jenkins Alethia | $90,000 | Amrock | |
| Jenkins Alethia | $90,000 | Amrock | |
| Cannon Carol | $30,000 | Surety Title | |
| Perno Joseph Peter | -- | -- |
Source: Public Records
Mortgage History
| Date | Status | Borrower | Loan Amount |
|---|---|---|---|
| Open | Jenkins Alethia | $88,369 | |
| Closed | Jenkins Alethia | $88,369 |
Source: Public Records
Tax History Compared to Growth
Tax History
| Year | Tax Paid | Tax Assessment Tax Assessment Total Assessment is a certain percentage of the fair market value that is determined by local assessors to be the total taxable value of land and additions on the property. | Land | Improvement |
|---|---|---|---|---|
| 2025 | $1,169 | $33,000 | $5,800 | $27,200 |
| 2024 | $1,130 | $33,000 | $5,800 | $27,200 |
| 2023 | $1,130 | $33,000 | $5,800 | $27,200 |
| 2022 | $1,109 | $33,000 | $5,800 | $27,200 |
| 2021 | $1,105 | $33,000 | $5,800 | $27,200 |
| 2020 | $1,049 | $33,000 | $5,800 | $27,200 |
| 2019 | $1,005 | $33,000 | $5,800 | $27,200 |
| 2018 | $1,000 | $33,000 | $5,800 | $27,200 |
| 2017 | $975 | $33,000 | $5,800 | $27,200 |
| 2016 | $944 | $33,000 | $5,800 | $27,200 |
| 2015 | $909 | $33,000 | $5,800 | $27,200 |
| 2014 | $887 | $33,000 | $5,800 | $27,200 |
Source: Public Records
Map
Nearby Homes