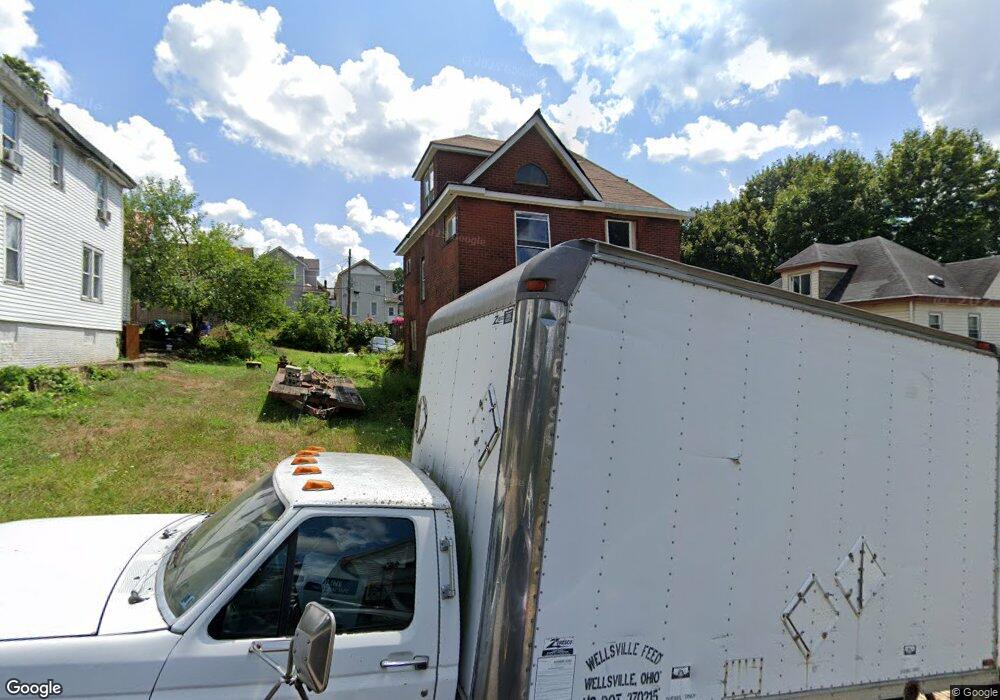
318 Blakely St East Liverpool, OH 43920
Estimated Value: $47,000 - $86,000
2
Beds
1
Bath
1,744
Sq Ft
$39/Sq Ft
Est. Value
About This Home
This home is located at 318 Blakely St, East Liverpool, OH 43920 and is currently estimated at $67,291, approximately $38 per square foot. 318 Blakely St is a home located in Columbiana County with nearby schools including Westgate Middle School, North Elementary School, and East Liverpool High School.
Ownership History
Date
Name
Owned For
Owner Type
Purchase Details
Closed on
Oct 13, 2005
Sold by
Little Mona Lee
Bought by
Ice Robert E
Current Estimated Value
Home Financials for this Owner
Home Financials are based on the most recent Mortgage that was taken out on this home.
Original Mortgage
$30,000
Interest Rate
15%
Mortgage Type
Seller Take Back
Purchase Details
Closed on
Mar 7, 2005
Sold by
Little Mona Lee
Bought by
Little Mona Lee and Little Shirley June
Purchase Details
Closed on
Jan 15, 2005
Sold by
Bowersock Kandi Lee and Bowersock Randy
Bought by
Little Mona Lee
Purchase Details
Closed on
Nov 18, 2004
Sold by
Malone Martin L and Malone Jeanne A
Bought by
Bowersock Kandi Lee
Purchase Details
Closed on
May 4, 1989
Bought by
Malone Martin L and Malone Or
Create a Home Valuation Report for This Property
The Home Valuation Report is an in-depth analysis detailing your home's value as well as a comparison with similar homes in the area
Home Values in the Area
Average Home Value in this Area
Purchase History
| Date | Buyer | Sale Price | Title Company |
|---|---|---|---|
| Ice Robert E | $30,000 | None Available | |
| Little Mona Lee | -- | None Available | |
| Little Mona Lee | -- | None Available | |
| Little Mona Lee | $12,000 | -- | |
| Bowersock Kandi Lee | -- | -- | |
| Malone Martin L | $8,000 | -- |
Source: Public Records
Mortgage History
| Date | Status | Borrower | Loan Amount |
|---|---|---|---|
| Closed | Ice Robert E | $30,000 |
Source: Public Records
Tax History Compared to Growth
Tax History
| Year | Tax Paid | Tax Assessment Tax Assessment Total Assessment is a certain percentage of the fair market value that is determined by local assessors to be the total taxable value of land and additions on the property. | Land | Improvement |
|---|---|---|---|---|
| 2024 | $399 | $9,450 | $420 | $9,030 |
| 2023 | $399 | $9,450 | $420 | $9,030 |
| 2022 | $703 | $16,660 | $420 | $16,240 |
| 2021 | $610 | $13,240 | $390 | $12,850 |
| 2020 | $610 | $13,240 | $390 | $12,850 |
| 2019 | $610 | $13,240 | $390 | $12,850 |
| 2018 | $591 | $12,040 | $350 | $11,690 |
| 2017 | $622 | $12,040 | $350 | $11,690 |
| 2016 | $621 | $12,670 | $350 | $12,320 |
| 2015 | $637 | $12,670 | $350 | $12,320 |
| 2014 | $630 | $12,670 | $350 | $12,320 |
Source: Public Records
Map
Nearby Homes