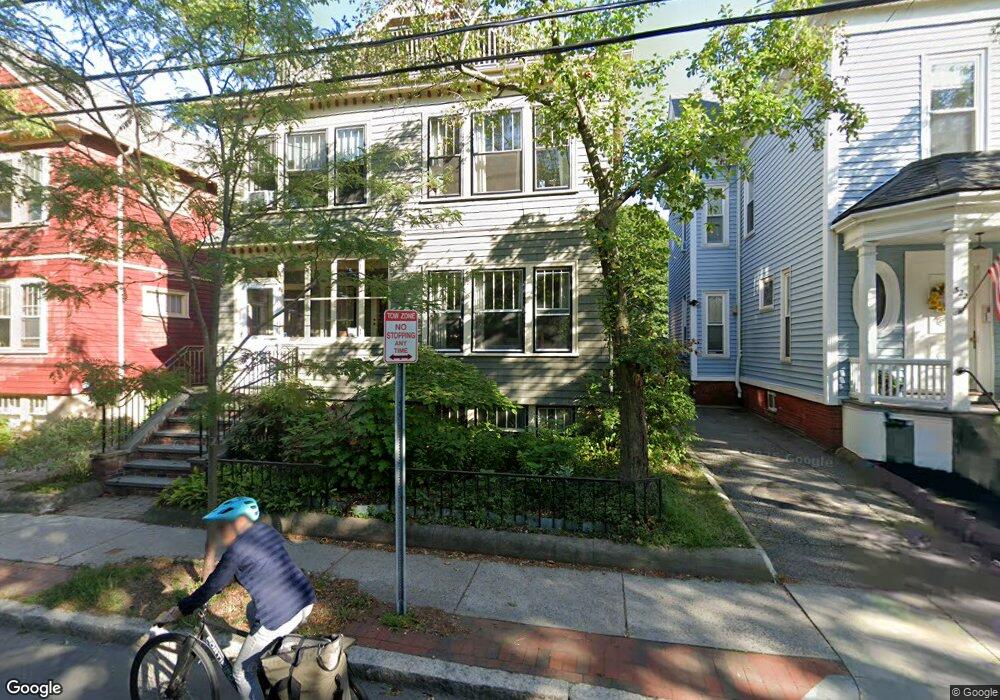
318 Brookline St Unit 320 Cambridge, MA 02139
Cambridgeport NeighborhoodEstimated Value: $1,014,000 - $1,239,000
2
Beds
3
Baths
1,440
Sq Ft
$769/Sq Ft
Est. Value
About This Home
This home is located at 318 Brookline St Unit 320, Cambridge, MA 02139 and is currently estimated at $1,107,205, approximately $768 per square foot. 318 Brookline St Unit 320 is a home located in Middlesex County with nearby schools including Prospect Hill Academy Charter School, New England Hebrew Academy, and Boston University Academy.
Ownership History
Date
Name
Owned For
Owner Type
Purchase Details
Closed on
Dec 15, 2009
Sold by
Stgoar Anne F and Page Shippen L
Bought by
320 Brookline St Rt and Page Shippen L
Current Estimated Value
Purchase Details
Closed on
Jul 20, 2005
Sold by
Munsat Amy E and Flamm Harry S
Bought by
Page Shippen L and Stgoar Anne F
Home Financials for this Owner
Home Financials are based on the most recent Mortgage that was taken out on this home.
Original Mortgage
$250,000
Interest Rate
5.59%
Mortgage Type
Purchase Money Mortgage
Purchase Details
Closed on
Nov 13, 1992
Sold by
Guay Brigitte M and Photopoulos Harry P
Bought by
Munsat Amy E and Flamm Harry S
Home Financials for this Owner
Home Financials are based on the most recent Mortgage that was taken out on this home.
Original Mortgage
$116,000
Interest Rate
7.88%
Mortgage Type
Purchase Money Mortgage
Create a Home Valuation Report for This Property
The Home Valuation Report is an in-depth analysis detailing your home's value as well as a comparison with similar homes in the area
Home Values in the Area
Average Home Value in this Area
Purchase History
| Date | Buyer | Sale Price | Title Company |
|---|---|---|---|
| 320 Brookline St Rt | -- | -- | |
| Page Shippen L | $505,000 | -- | |
| Munsat Amy E | $145,000 | -- |
Source: Public Records
Mortgage History
| Date | Status | Borrower | Loan Amount |
|---|---|---|---|
| Previous Owner | Page Shippen L | $250,000 | |
| Previous Owner | Munsat Amy E | $116,000 |
Source: Public Records
Tax History Compared to Growth
Tax History
| Year | Tax Paid | Tax Assessment Tax Assessment Total Assessment is a certain percentage of the fair market value that is determined by local assessors to be the total taxable value of land and additions on the property. | Land | Improvement |
|---|---|---|---|---|
| 2025 | $5,996 | $944,200 | $0 | $944,200 |
| 2024 | $5,670 | $957,700 | $0 | $957,700 |
| 2023 | $5,215 | $890,000 | $0 | $890,000 |
| 2022 | $5,194 | $877,400 | $0 | $877,400 |
| 2021 | $5,084 | $869,000 | $0 | $869,000 |
| 2020 | $4,760 | $827,900 | $0 | $827,900 |
| 2019 | $4,561 | $767,900 | $0 | $767,900 |
| 2018 | $4,431 | $704,400 | $0 | $704,400 |
| 2017 | $4,376 | $674,200 | $0 | $674,200 |
| 2016 | $4,244 | $607,200 | $0 | $607,200 |
| 2015 | $4,204 | $537,600 | $0 | $537,600 |
| 2014 | $4,139 | $493,900 | $0 | $493,900 |
Source: Public Records
Map
Nearby Homes
- 260 Sidney St Unit 3R
- 214 Allston St
- 174 Hamilton St
- 161 Hamilton St
- 131 Erie St Unit 3
- 131 Erie St
- 8 Watson St Unit 8
- 6-8 Watson St Unit 8
- 1 Jay St
- 127 Auburn St
- 129 Auburn St
- 19 Thatcher St Unit E13
- 180 Ivy St
- 178 Ivy St
- 300 Franklin St Unit 5
- 300 Franklin St Unit 1
- 300 Franklin St Unit 2
- 2 Hingham St
- 462 Park Dr
- 566 Commonwealth Ave Unit L101
- 318 Brookline St Unit 320
- 318 Brookline St Unit R
- 318 Brookline St Unit 320
- 65 Henry St
- 62 Chestnut St
- 72 Chestnut St
- 72 Chestnut St Unit 2
- 72 Chestnut St Unit 72
- 72 Chestnut St Unit A
- 314 Brookline St
- 314 Brookline St Unit 2
- 316 Brookline St Unit 1
- 63 Henry St
- 66 Chestnut St
- 320 Brookline St Unit 1
- 308 Brookline St Unit 1
- 308 Brookline St Unit BC
- 308 Brookline St Unit BB
- 308 Brookline St Unit 5C
- 308 Brookline St Unit 5B