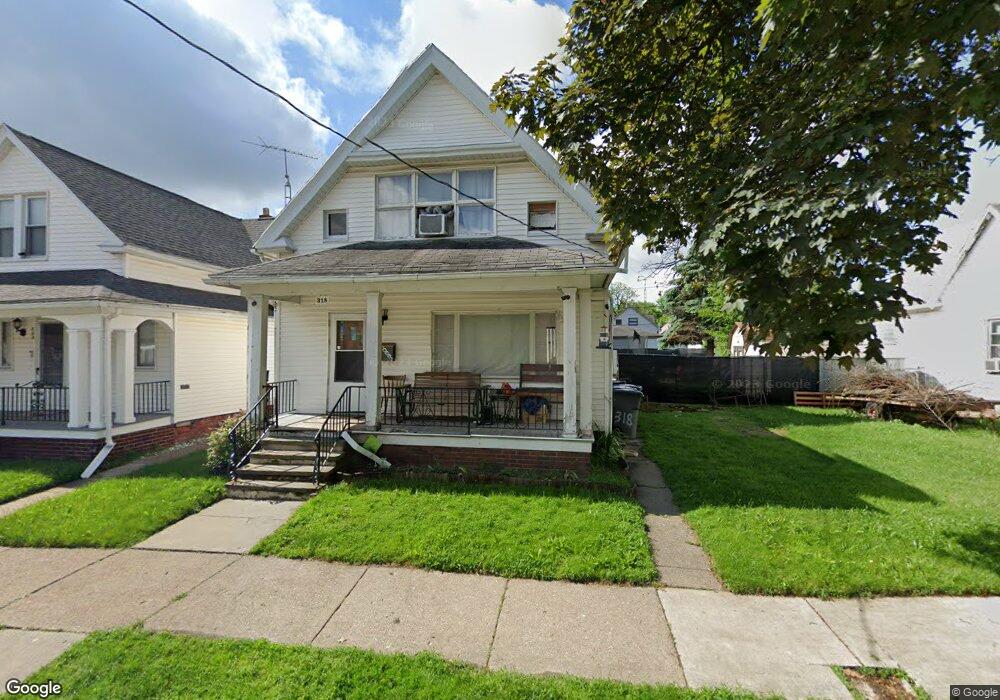
318 Dexter St Toledo, OH 43608
Lagrange NeighborhoodEstimated Value: $68,678 - $90,000
3
Beds
1
Bath
2,033
Sq Ft
$39/Sq Ft
Est. Value
About This Home
This home is located at 318 Dexter St, Toledo, OH 43608 and is currently estimated at $79,420, approximately $39 per square foot. 318 Dexter St is a home located in Lucas County with nearby schools including Spring Elementary School, Woodward High School, and Central Catholic High School.
Ownership History
Date
Name
Owned For
Owner Type
Purchase Details
Closed on
Jun 16, 2022
Sold by
318 Dexter Ltd
Bought by
Baker Mark A and Baker Deborah A
Current Estimated Value
Purchase Details
Closed on
Dec 3, 2008
Sold by
Goldman Robert B
Bought by
318 Dexter Ltd
Purchase Details
Closed on
Aug 1, 2008
Sold by
Wells Fargo Bank Na
Bought by
Goldman Robert B
Purchase Details
Closed on
Nov 1, 2007
Sold by
Teel Dinah
Bought by
Wells Fargo Bank Na
Purchase Details
Closed on
Nov 7, 2005
Sold by
Teel Dinah
Bought by
Teel Dinah
Purchase Details
Closed on
Apr 30, 2003
Sold by
Dutkiewicz Norma and Dutkiewicz Gary
Bought by
Teel Dinah
Home Financials for this Owner
Home Financials are based on the most recent Mortgage that was taken out on this home.
Original Mortgage
$40,410
Interest Rate
5.86%
Mortgage Type
Purchase Money Mortgage
Create a Home Valuation Report for This Property
The Home Valuation Report is an in-depth analysis detailing your home's value as well as a comparison with similar homes in the area
Home Values in the Area
Average Home Value in this Area
Purchase History
We collect this data history from publicly available records. To have your information removed, we recommend requesting removal directly through your county’s website.
| Date | Buyer | Sale Price | Title Company |
|---|---|---|---|
| Baker Mark A | $300 | Hart James H | |
| 318 Dexter Ltd | -- | Attorney | |
| Goldman Robert B | $8,000 | None Available | |
| Wells Fargo Bank Na | $36,000 | None Available | |
| Teel Dinah | -- | None Available | |
| Teel Dinah | $44,900 | Northwest Title Agency Of Oh |
Source: Public Records
Mortgage History
We collect this data history from publicly available records. To have your information removed, we recommend requesting removal directly through your county’s website.
| Date | Status | Borrower | Loan Amount |
|---|---|---|---|
| Previous Owner | Teel Dinah | $40,410 |
Source: Public Records
Tax History
| Year | Tax Paid | Tax Assessment Tax Assessment Total Assessment is a certain percentage of the fair market value that is determined by local assessors to be the total taxable value of land and additions on the property. | Land | Improvement |
|---|---|---|---|---|
| 2025 | $12,255 | $23,765 | $3,185 | $20,580 |
| 2024 | $18,992 | $23,765 | $3,185 | $20,580 |
| 2023 | $1,333 | $19,530 | $1,505 | $18,025 |
| 2022 | $1,353 | $19,530 | $1,505 | $18,025 |
| 2021 | $1,361 | $19,530 | $1,505 | $18,025 |
| 2020 | $1,492 | $18,970 | $1,435 | $17,535 |
| 2019 | $1,455 | $18,970 | $1,435 | $17,535 |
| 2018 | $1,441 | $18,970 | $1,435 | $17,535 |
| 2017 | $20,030 | $18,550 | $1,400 | $17,150 |
| 2016 | $16,391 | $53,000 | $4,000 | $49,000 |
| 2015 | $1,435 | $53,000 | $4,000 | $49,000 |
| 2014 | $1,798 | $18,550 | $1,400 | $17,150 |
| 2013 | $1,199 | $18,550 | $1,400 | $17,150 |
Source: Public Records
Map
Nearby Homes
- 240 Dexter St Unit 2
- 240 Dexter St Unit 1
- 236 Dexter St
- 306 Dexter St
- 310 Dexter St
- 230 Dexter St
- 314 Dexter St
- 222 Dexter St
- 231 Everett St
- 233 Everett St
- 227 Everett St
- 237 Everett St
- 221 Everett St
- 309 Everett St
- 216 Dexter St
- 320 Dexter St
- 309 Dexter St
- 219 Everett St
- 315 Dexter St
- 311 Everett St
Your Personal Tour Guide
Ask me questions while you tour the home.