Estimated Value: $347,000 - $389,000
4
Beds
3
Baths
2,206
Sq Ft
$162/Sq Ft
Est. Value
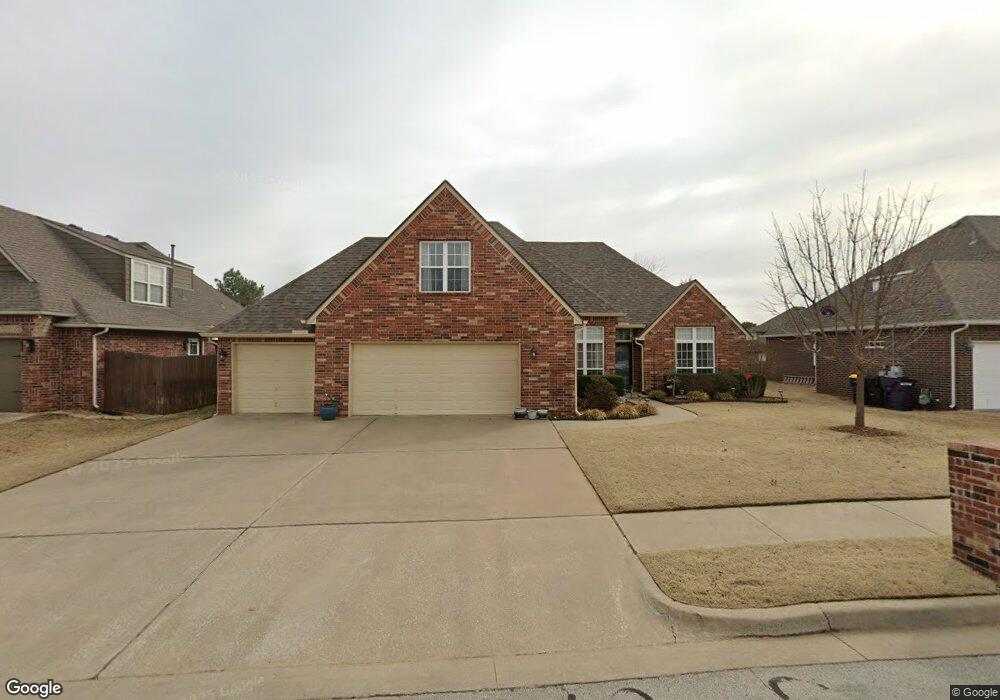
About This Home
This home is located at 318 E 112th St S, Jenks, OK 74037 and is currently estimated at $357,590, approximately $162 per square foot. 318 E 112th St S is a home located in Tulsa County with nearby schools including Jenks West Elementary School, Jenks West Intermediate Elementary School, and Jenks Middle School.
Ownership History
Date
Name
Owned For
Owner Type
Purchase Details
Closed on
Sep 1, 2015
Sold by
Sanders Mark A
Bought by
The Sanders Fasano Trust
Current Estimated Value
Purchase Details
Closed on
Jul 24, 2008
Sold by
Doyon Andre Jewell and Saferite Linda Lee
Bought by
Doyon/Saferite 2000 Trust
Home Financials for this Owner
Home Financials are based on the most recent Mortgage that was taken out on this home.
Original Mortgage
$119,000
Outstanding Balance
$78,045
Interest Rate
6.4%
Mortgage Type
New Conventional
Estimated Equity
$279,546
Purchase Details
Closed on
Jul 21, 2008
Sold by
Doyon/Saferite 2000 Trust
Bought by
Sanders Mark A
Home Financials for this Owner
Home Financials are based on the most recent Mortgage that was taken out on this home.
Original Mortgage
$119,000
Outstanding Balance
$78,045
Interest Rate
6.4%
Mortgage Type
New Conventional
Estimated Equity
$279,546
Purchase Details
Closed on
Jan 4, 2005
Sold by
Saferite Linda L and Doyon Andre J
Bought by
Doyon/Saferite 2000 Trust
Purchase Details
Closed on
Nov 18, 2004
Sold by
R Cooke Homes Inc
Bought by
Doyon Andre and Saferite Linda L
Create a Home Valuation Report for This Property
The Home Valuation Report is an in-depth analysis detailing your home's value as well as a comparison with similar homes in the area
Home Values in the Area
Average Home Value in this Area
Purchase History
| Date | Buyer | Sale Price | Title Company |
|---|---|---|---|
| The Sanders Fasano Trust | -- | Attorney | |
| Doyon/Saferite 2000 Trust | -- | First American Title & Abstr | |
| Sanders Mark A | $214,000 | Multiple | |
| Doyon/Saferite 2000 Trust | -- | -- | |
| Doyon Andre | $213,500 | First American Title & Abstr |
Source: Public Records
Mortgage History
| Date | Status | Borrower | Loan Amount |
|---|---|---|---|
| Open | Sanders Mark A | $119,000 |
Source: Public Records
Tax History Compared to Growth
Tax History
| Year | Tax Paid | Tax Assessment Tax Assessment Total Assessment is a certain percentage of the fair market value that is determined by local assessors to be the total taxable value of land and additions on the property. | Land | Improvement |
|---|---|---|---|---|
| 2024 | $3,052 | $24,723 | $3,021 | $21,702 |
| 2023 | $3,052 | $24,974 | $3,291 | $21,683 |
| 2022 | $2,988 | $23,246 | $4,009 | $19,237 |
| 2021 | $2,935 | $22,540 | $3,887 | $18,653 |
| 2020 | $2,870 | $22,540 | $3,887 | $18,653 |
| 2019 | $2,890 | $22,540 | $3,887 | $18,653 |
| 2018 | $2,910 | $22,540 | $3,887 | $18,653 |
| 2017 | $2,862 | $23,540 | $4,059 | $19,481 |
| 2016 | $2,932 | $23,540 | $4,059 | $19,481 |
| 2015 | $2,988 | $23,540 | $4,059 | $19,481 |
| 2014 | $3,056 | $23,540 | $4,059 | $19,481 |
Source: Public Records
Map
Nearby Homes
- 418 E 111th St S
- 208 E 113th St S
- 11304 S 2nd St
- 205 E 116th St
- 11207 S 1st St
- 11427 S Ash St
- 187 E 116th St
- 1734 W 115th Place
- 107 E 116th Place
- 701 E 119th St S
- 682 W 113th Ct S
- 691 W 113th Ct S
- 11265 S Fir Ave
- 11261 S Fir Ave
- 11264 S Fir Ave
- 11312 S Fir Ave
- 11308 S Fir Ave
- 11260 S Fir Ave
- 11224 S Fir Ave
- 10625 S Forest Ave
- 322 E 112th St S
- 314 E 112th St S
- 321 E 113th St S
- 319 E 113th St S
- 310 E 112th St S
- 326 E 112th St S
- 543 E 112th St S
- 555 E 112th St S
- 317 E 113th St S
- 317 E 112th St S
- 313 E 112th St S
- 323 E 113th St S
- 321 E 112th St S
- 306 E 112th St S
- 423 E 113th St S
- 330 E 112th St S
- 309 E 112th St S
- 411 E 113th St S
- 325 E 112th St S
- 333 E 112th St S