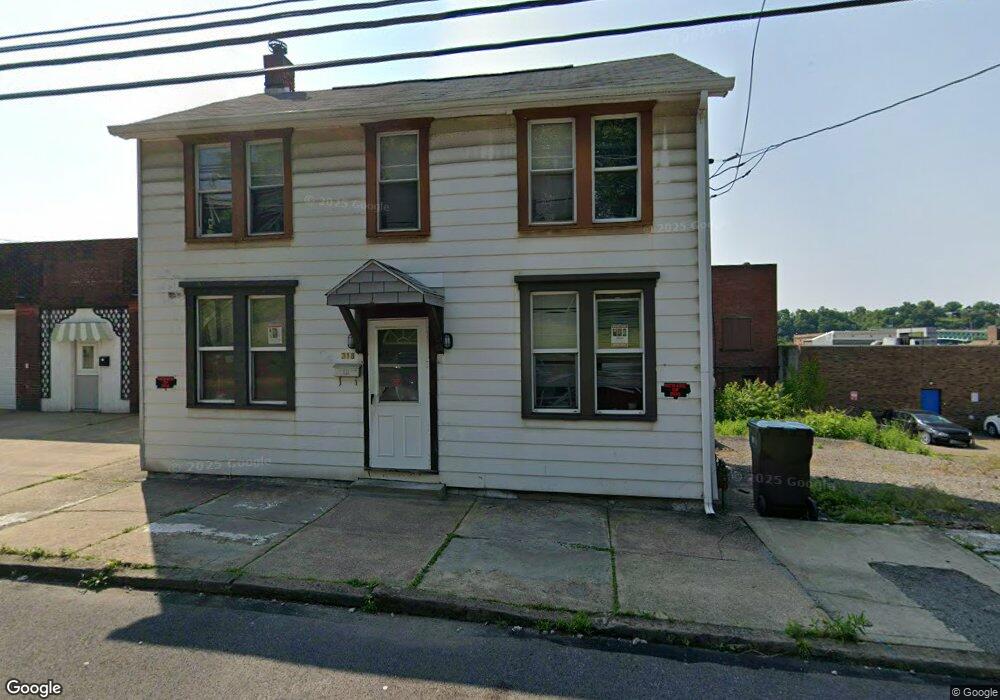
318 E 7th Ave Tarentum, PA 15084
Estimated Value: $45,000 - $85,000
2
Beds
3
Baths
1,236
Sq Ft
$50/Sq Ft
Est. Value
About This Home
This home is located at 318 E 7th Ave, Tarentum, PA 15084 and is currently estimated at $61,265, approximately $49 per square foot. 318 E 7th Ave is a home located in Allegheny County with nearby schools including Highlands Senior High School, Mary Queen of Apostles School, and St. Joseph High School.
Ownership History
Date
Name
Owned For
Owner Type
Purchase Details
Closed on
Aug 24, 2020
Sold by
Schuster Kody B and Mason Andrea
Bought by
Bandaru Vishal B
Current Estimated Value
Purchase Details
Closed on
Aug 11, 2016
Sold by
Sommer Janice M and Sommer Wallace E
Bought by
Mason Andrea and Schustler Kody B
Home Financials for this Owner
Home Financials are based on the most recent Mortgage that was taken out on this home.
Original Mortgage
$40,000
Interest Rate
3.41%
Mortgage Type
Purchase Money Mortgage
Create a Home Valuation Report for This Property
The Home Valuation Report is an in-depth analysis detailing your home's value as well as a comparison with similar homes in the area
Home Values in the Area
Average Home Value in this Area
Purchase History
| Date | Buyer | Sale Price | Title Company |
|---|---|---|---|
| Bandaru Vishal B | $25,000 | None Available | |
| Mason Andrea | $50,000 | Attorney |
Source: Public Records
Mortgage History
| Date | Status | Borrower | Loan Amount |
|---|---|---|---|
| Previous Owner | Mason Andrea | $40,000 |
Source: Public Records
Tax History
| Year | Tax Paid | Tax Assessment Tax Assessment Total Assessment is a certain percentage of the fair market value that is determined by local assessors to be the total taxable value of land and additions on the property. | Land | Improvement |
|---|---|---|---|---|
| 2025 | $668 | $18,900 | $6,600 | $12,300 |
| 2024 | $668 | $18,900 | $6,600 | $12,300 |
| 2023 | $668 | $18,900 | $6,600 | $12,300 |
| 2022 | $663 | $18,900 | $6,600 | $12,300 |
| 2021 | $89 | $18,900 | $6,600 | $12,300 |
| 2020 | $663 | $18,900 | $6,600 | $12,300 |
| 2019 | $658 | $18,900 | $6,600 | $12,300 |
| 2017 | $643 | $18,900 | $6,600 | $12,300 |
Source: Public Records
Map
Nearby Homes
Your Personal Tour Guide
Ask me questions while you tour the home.