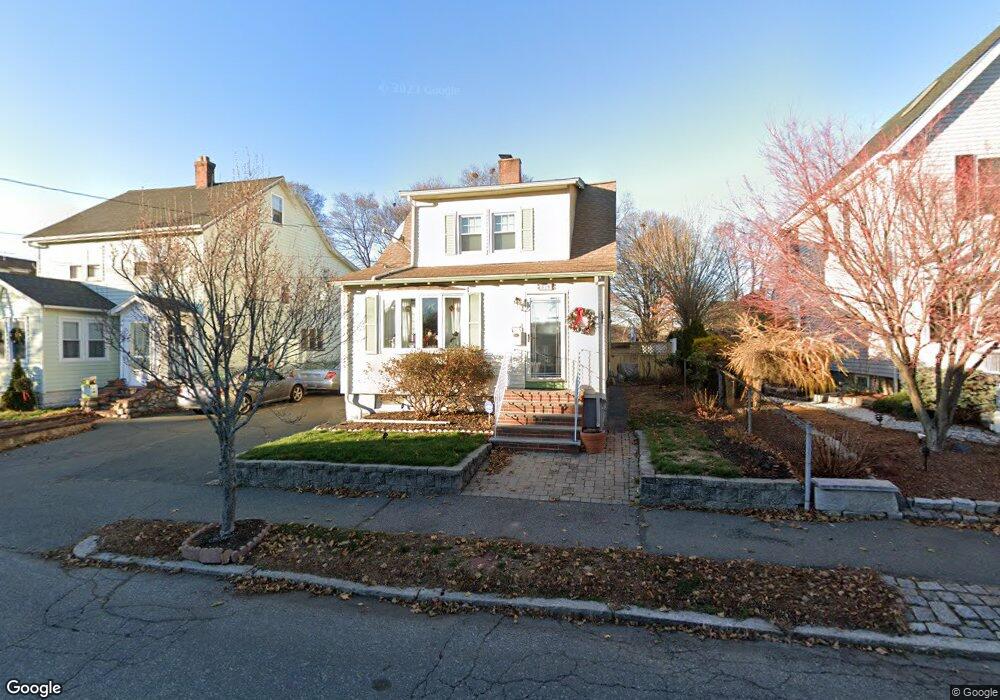
318 E Foster St Melrose, MA 02176
Melrose East Side NeighborhoodEstimated Value: $843,402 - $941,000
2
Beds
3
Baths
1,416
Sq Ft
$630/Sq Ft
Est. Value
About This Home
This home is located at 318 E Foster St, Melrose, MA 02176 and is currently estimated at $892,101, approximately $630 per square foot. 318 E Foster St is a home located in Middlesex County with nearby schools including Winthrop Elementary School, Hoover Elementary School, and Horace Mann Elementary School.
Ownership History
Date
Name
Owned For
Owner Type
Purchase Details
Closed on
Jan 2, 2015
Sold by
Palmer Selwyn E and Palmer Ellen B
Bought by
Palmer Selwyn E and Palmer Ellen B
Current Estimated Value
Purchase Details
Closed on
Dec 16, 1977
Bought by
Selwyn Palmer E and Palmer Ellen B
Create a Home Valuation Report for This Property
The Home Valuation Report is an in-depth analysis detailing your home's value as well as a comparison with similar homes in the area
Home Values in the Area
Average Home Value in this Area
Purchase History
| Date | Buyer | Sale Price | Title Company |
|---|---|---|---|
| Palmer Selwyn E | -- | -- | |
| Selwyn Palmer E | $44,000 | -- |
Source: Public Records
Tax History
| Year | Tax Paid | Tax Assessment Tax Assessment Total Assessment is a certain percentage of the fair market value that is determined by local assessors to be the total taxable value of land and additions on the property. | Land | Improvement |
|---|---|---|---|---|
| 2025 | $75 | $754,500 | $446,700 | $307,800 |
| 2024 | $7,160 | $721,000 | $419,700 | $301,300 |
| 2023 | $7,153 | $686,500 | $406,100 | $280,400 |
| 2022 | $7,155 | $676,900 | $406,100 | $270,800 |
| 2021 | $6,886 | $628,900 | $379,100 | $249,800 |
| 2020 | $6,501 | $588,300 | $338,400 | $249,900 |
| 2019 | $5,874 | $543,400 | $312,700 | $230,700 |
| 2018 | $5,835 | $515,000 | $284,300 | $230,700 |
| 2017 | $5,671 | $480,600 | $270,800 | $209,800 |
| 2016 | $5,373 | $435,800 | $264,000 | $171,800 |
| 2015 | $5,091 | $392,800 | $236,900 | $155,900 |
| 2014 | $4,856 | $365,700 | $209,800 | $155,900 |
Source: Public Records
Map
Nearby Homes
- 187 Laurel St
- 30 Wheeler Ave
- 311 Beech Ave
- 71-73 Grove St
- 7 Birch Hill Rd
- 9 Elmcrest Cir
- 48 Malvern St Unit 2
- 109 Linden Rd
- 1 Mill Rd
- 236-238 Main St
- 65 Beacon St
- 8 Crystal St Unit 2
- 8 Crystal St Unit 3
- 128 Green St Unit 128
- 77 Lynde St
- 31 Temple St
- 333 Main St
- 53 Melrose St Unit 4D
- 340 Main St Unit 508
- 340 Main St Unit 206
Your Personal Tour Guide
Ask me questions while you tour the home.