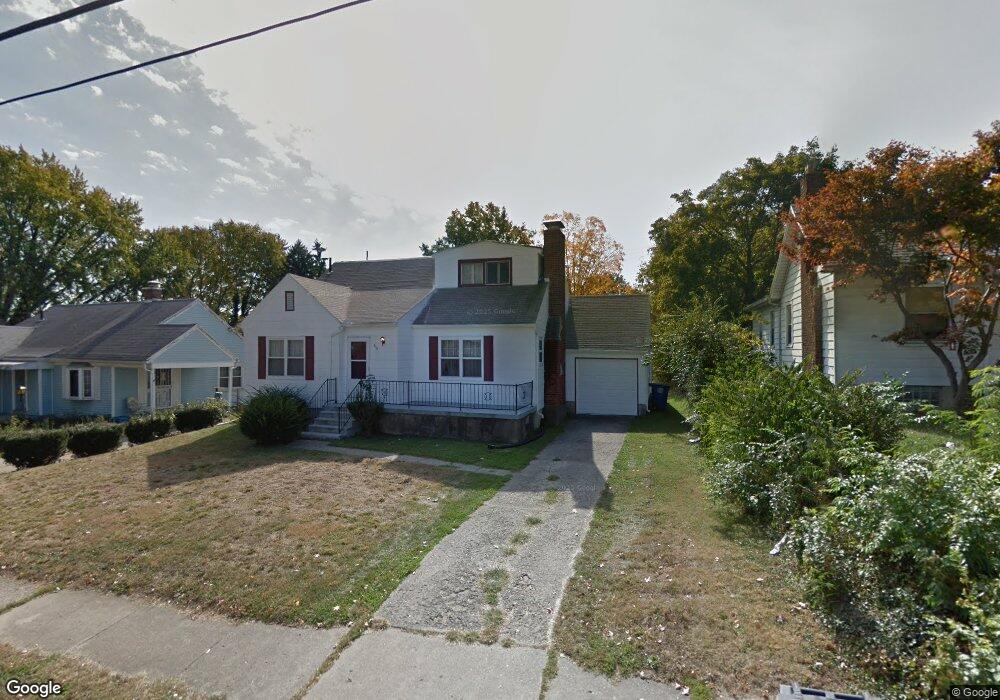
318 E Siebenthaler Ave Dayton, OH 45405
North Riverdale NeighborhoodEstimated Value: $131,000 - $152,000
3
Beds
2
Baths
1,492
Sq Ft
$94/Sq Ft
Est. Value
About This Home
This home is located at 318 E Siebenthaler Ave, Dayton, OH 45405 and is currently estimated at $140,627, approximately $94 per square foot. 318 E Siebenthaler Ave is a home located in Montgomery County with nearby schools including Valerie Elementary School, Horizon Science Academy-Dayton Elementary School, and Horizon Science Academy Dayton High School.
Ownership History
Date
Name
Owned For
Owner Type
Purchase Details
Closed on
Dec 2, 2013
Sold by
Brown Edith
Bought by
Pnc Bank Na
Current Estimated Value
Purchase Details
Closed on
Nov 22, 2013
Sold by
Brown Edith
Bought by
Pnc Bank Na
Purchase Details
Closed on
Nov 14, 2013
Sold by
Pnc Bank Na
Bought by
The Secretary Of Hud
Purchase Details
Closed on
Dec 19, 2000
Sold by
Lawson James E and Combs Linda K
Bought by
Brown Edith
Home Financials for this Owner
Home Financials are based on the most recent Mortgage that was taken out on this home.
Original Mortgage
$64,966
Interest Rate
7.8%
Mortgage Type
FHA
Purchase Details
Closed on
Mar 1, 2000
Sold by
Rohrer Olan F and Rohrer Olan F
Bought by
Lawson James E and Combs Linda K
Purchase Details
Closed on
Sep 22, 1999
Sold by
Rohrer Julia A and Ann Julia
Bought by
Rohrer Olan F
Create a Home Valuation Report for This Property
The Home Valuation Report is an in-depth analysis detailing your home's value as well as a comparison with similar homes in the area
Home Values in the Area
Average Home Value in this Area
Purchase History
| Date | Buyer | Sale Price | Title Company |
|---|---|---|---|
| Pnc Bank Na | $6,000 | None Available | |
| Pnc Bank Na | $6,000 | None Available | |
| The Secretary Of Hud | -- | None Available | |
| Brown Edith | $65,000 | -- | |
| Lawson James E | $20,000 | -- | |
| Rohrer Olan F | -- | -- | |
| Rohrer Olan F | -- | -- |
Source: Public Records
Mortgage History
| Date | Status | Borrower | Loan Amount |
|---|---|---|---|
| Previous Owner | Brown Edith | $64,966 |
Source: Public Records
Tax History
| Year | Tax Paid | Tax Assessment Tax Assessment Total Assessment is a certain percentage of the fair market value that is determined by local assessors to be the total taxable value of land and additions on the property. | Land | Improvement |
|---|---|---|---|---|
| 2025 | $759 | $12,580 | $5,910 | $6,670 |
| 2024 | $740 | $12,580 | $5,910 | $6,670 |
| 2023 | $740 | $12,580 | $5,910 | $6,670 |
| 2022 | $699 | $9,180 | $4,310 | $4,870 |
| 2021 | $696 | $9,180 | $4,310 | $4,870 |
| 2020 | $673 | $9,180 | $4,310 | $4,870 |
| 2019 | $633 | $7,590 | $4,310 | $3,280 |
| 2018 | $656 | $7,590 | $4,310 | $3,280 |
| 2017 | $651 | $7,590 | $4,310 | $3,280 |
| 2016 | $732 | $8,410 | $4,310 | $4,100 |
| 2015 | $712 | $8,410 | $4,310 | $4,100 |
| 2014 | $712 | $13,620 | $4,310 | $9,310 |
| 2012 | -- | $18,850 | $6,240 | $12,610 |
Source: Public Records
Map
Nearby Homes
- 305 E Siebenthaler Ave
- 221 E Siebenthaler Ave
- 200 E Siebenthaler Ave
- 128 E Bruce Ave
- 332 Ashwood Ave
- 55 E Siebenthaler Ave
- 53 E Siebenthaler Ave
- 124 Knecht Dr
- 43 Knecht Dr
- 619 Daleview Ave
- 34 Fer Don Rd
- 44 Fer Don Rd
- 3303 N Main St
- 3855 Addison Ave
- 52 Fernwood Ave
- 126 Fernwood Ave
- 57 Pointview Ave
- 49 Pointview Ave
- 25 Redwood Ave
- 3901 Old Riverside Dr
- 304 E Siebenthaler Ave
- 320 E Siebenthaler Ave
- 300 E Siebenthaler Ave
- 322 E Siebenthaler Ave
- 324 E Siebenthaler Ave
- 215 Ashwood Ave
- 207 Ashwood Ave
- 219 Ashwood Ave
- 328 E Siebenthaler Ave
- 258 E Siebenthaler Ave
- 313 E Siebenthaler Ave
- 225 Ashwood Ave
- 309 E Siebenthaler Ave
- 319 E Siebenthaler Ave
- 332 E Siebenthaler Ave
- 323 E Siebenthaler Ave
- 301 E Siebenthaler Ave
- 161 Ashwood Ave
- 254 E Siebenthaler Ave
- 327 E Siebenthaler Ave
Your Personal Tour Guide
Ask me questions while you tour the home.