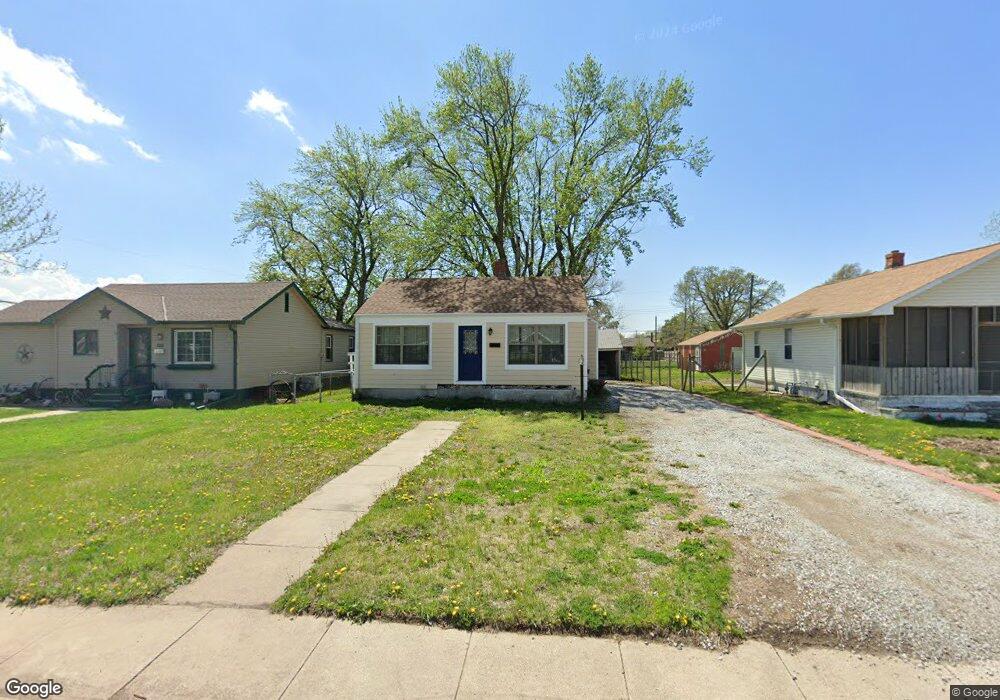
318 E Thurber St Clay Center, NE 68933
Estimated Value: $126,000 - $148,000
2
Beds
1
Bath
956
Sq Ft
$145/Sq Ft
Est. Value
About This Home
This home is located at 318 E Thurber St, Clay Center, NE 68933 and is currently estimated at $138,817, approximately $145 per square foot. 318 E Thurber St is a home located in Clay County with nearby schools including Clay Center Elementary School.
Ownership History
Date
Name
Owned For
Owner Type
Purchase Details
Closed on
Sep 23, 2024
Sold by
Cynthia Koester Design And Development L
Bought by
Cast Erika Elsie and Cast Lilly Margaret
Current Estimated Value
Home Financials for this Owner
Home Financials are based on the most recent Mortgage that was taken out on this home.
Original Mortgage
$128,700
Outstanding Balance
$127,259
Interest Rate
6.49%
Mortgage Type
New Conventional
Estimated Equity
$11,558
Purchase Details
Closed on
Mar 28, 2012
Sold by
Byron State Bank
Bought by
Koester Cynthia S
Purchase Details
Closed on
Mar 26, 2012
Sold by
Mahieu Jerry and Mahieu Ruth A
Bought by
Byron State Bank
Purchase Details
Closed on
Jul 13, 2005
Sold by
Frazier Lance D and Frazier Bree
Bought by
Mahieu Jerry
Create a Home Valuation Report for This Property
The Home Valuation Report is an in-depth analysis detailing your home's value as well as a comparison with similar homes in the area
Purchase History
| Date | Buyer | Sale Price | Title Company |
|---|---|---|---|
| Cast Erika Elsie | $143,000 | Adams Land Title | |
| Koester Cynthia S | -- | Charter Title And Escrow Ser | |
| Byron State Bank | $8,100 | Byron State Bank | |
| Mahieu Jerry | -- | -- |
Source: Public Records
Mortgage History
| Date | Status | Borrower | Loan Amount |
|---|---|---|---|
| Open | Cast Erika Elsie | $128,700 |
Source: Public Records
Tax History
| Year | Tax Paid | Tax Assessment Tax Assessment Total Assessment is a certain percentage of the fair market value that is determined by local assessors to be the total taxable value of land and additions on the property. | Land | Improvement |
|---|---|---|---|---|
| 2025 | $1,168 | $90,095 | $6,930 | $83,165 |
| 2024 | $1,137 | $90,095 | $6,930 | $83,165 |
| 2023 | $1,440 | $89,465 | $6,160 | $83,305 |
| 2022 | $1,229 | $66,180 | $2,100 | $64,080 |
| 2021 | $1,188 | $62,555 | $2,100 | $60,455 |
| 2020 | $1,159 | $60,340 | $2,100 | $58,240 |
| 2019 | $1,007 | $56,025 | $2,100 | $53,925 |
| 2018 | $980 | $54,525 | $2,100 | $52,425 |
| 2017 | $689 | $40,695 | $2,100 | $38,595 |
| 2016 | $746 | $40,695 | $2,100 | $38,595 |
| 2015 | $466 | $23,955 | $2,100 | $21,855 |
| 2014 | $639 | $23,955 | $2,100 | $21,855 |
| 2013 | $639 | $26,145 | $1,960 | $24,185 |
Source: Public Records
Map
Nearby Homes
- 200 E Harvard St
- 0 Pheasant View Lots
- 511 N Adams Ave
- 31660 P Rd
- Parcel 2 Walnut St
- Sutton Unit NE 68979
- 32011 Road J
- Road 315
- 811 S Saunders Ave
- 712 S Maltby Ave
- 508 7th St
- 502 S Maltby Ave
- 403 S Way
- Fairfield Unit Nebraska
- 512 N James Ave
- 111 E Forrest St
- 209 E Grove St
- 604 3rd St
- 505 N Saunders Ave
- 902 N Saunders Ave
- 320 E Thurber St
- 312 E Thurber St
- 518 N Center St
- 518 N Center St
- 512 N Center St
- 321 E George St
- 508 N Center St
- 504 N Center St
- 317 E Thurber St
- 321 E Thurber St
- 313 E Thurber St
- 309 E Thurber St
- 500 N Center St
- 600 N Center St
- 604 N Center St
- 615 N Calvary Ave
- 519 N Center St
- 521 N Center St
- 513 N Center St
- 507 N Center St
Your Personal Tour Guide
Ask me questions while you tour the home.