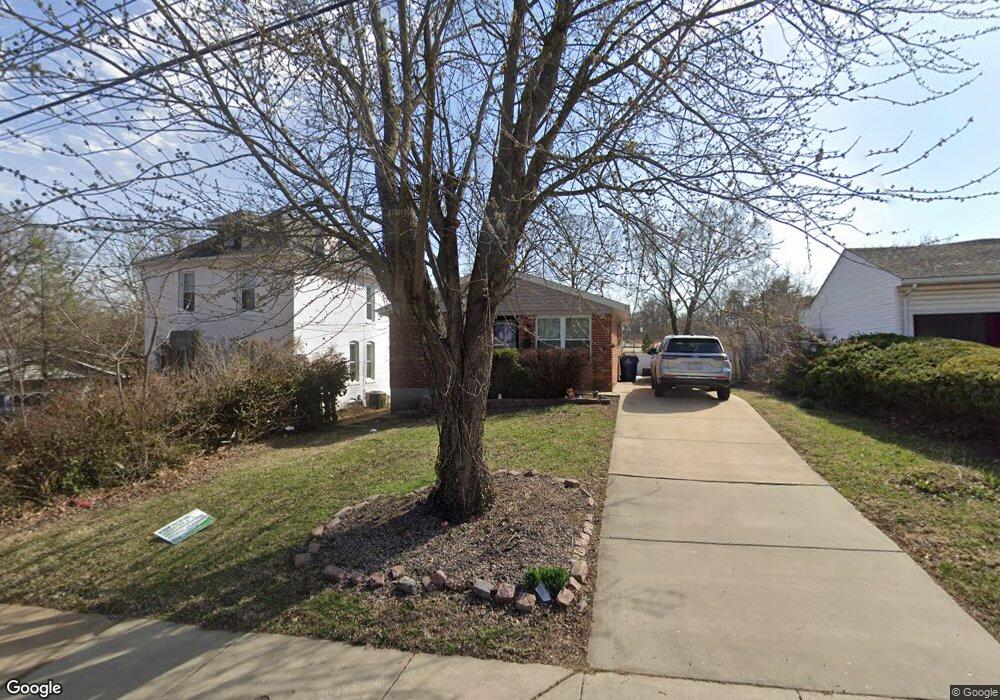
318 Euclid Ave Saint Louis, MO 63119
Estimated Value: $219,319 - $262,000
3
Beds
1
Bath
864
Sq Ft
$271/Sq Ft
Est. Value
About This Home
This home is located at 318 Euclid Ave, Saint Louis, MO 63119 and is currently estimated at $233,830, approximately $270 per square foot. 318 Euclid Ave is a home located in St. Louis County with nearby schools including Edgar Road Elementary School, Hixson Middle School, and Webster Groves High School.
Ownership History
Date
Name
Owned For
Owner Type
Purchase Details
Closed on
Dec 5, 2018
Sold by
Tretter Bradley M and Tretter Bryony
Bought by
Reed Michelle Marie
Current Estimated Value
Home Financials for this Owner
Home Financials are based on the most recent Mortgage that was taken out on this home.
Original Mortgage
$145,809
Outstanding Balance
$130,198
Interest Rate
5.5%
Mortgage Type
FHA
Estimated Equity
$103,632
Purchase Details
Closed on
Jul 6, 2007
Sold by
Wendel Dawn M
Bought by
Tretter Bradley M
Home Financials for this Owner
Home Financials are based on the most recent Mortgage that was taken out on this home.
Original Mortgage
$119,400
Interest Rate
6.41%
Mortgage Type
Purchase Money Mortgage
Purchase Details
Closed on
Mar 31, 2003
Sold by
Newman Edward L
Bought by
Wendel Dawn M
Home Financials for this Owner
Home Financials are based on the most recent Mortgage that was taken out on this home.
Original Mortgage
$85,700
Interest Rate
5.77%
Mortgage Type
FHA
Purchase Details
Closed on
Jan 20, 1998
Sold by
Anne Ekpelu Viola
Bought by
Newman Edward L
Create a Home Valuation Report for This Property
The Home Valuation Report is an in-depth analysis detailing your home's value as well as a comparison with similar homes in the area
Home Values in the Area
Average Home Value in this Area
Purchase History
| Date | Buyer | Sale Price | Title Company |
|---|---|---|---|
| Reed Michelle Marie | $148,500 | Title Partners Agency Llc | |
| Tretter Bradley M | $119,750 | None Available | |
| Wendel Dawn M | $87,000 | -- | |
| Newman Edward L | -- | -- | |
| Newman Edward L | -- | -- |
Source: Public Records
Mortgage History
| Date | Status | Borrower | Loan Amount |
|---|---|---|---|
| Open | Reed Michelle Marie | $145,809 | |
| Previous Owner | Tretter Bradley M | $119,400 | |
| Previous Owner | Wendel Dawn M | $85,700 |
Source: Public Records
Tax History Compared to Growth
Tax History
| Year | Tax Paid | Tax Assessment Tax Assessment Total Assessment is a certain percentage of the fair market value that is determined by local assessors to be the total taxable value of land and additions on the property. | Land | Improvement |
|---|---|---|---|---|
| 2025 | $2,422 | $39,880 | $21,910 | $17,970 |
| 2024 | $2,422 | $33,500 | $14,080 | $19,420 |
| 2023 | $2,450 | $33,500 | $14,080 | $19,420 |
| 2022 | $2,300 | $29,340 | $14,080 | $15,260 |
| 2021 | $2,286 | $29,340 | $14,080 | $15,260 |
| 2020 | $2,090 | $25,620 | $9,390 | $16,230 |
| 2019 | $2,078 | $25,620 | $9,390 | $16,230 |
| 2018 | $1,820 | $19,680 | $6,800 | $12,880 |
| 2017 | $1,811 | $19,680 | $6,800 | $12,880 |
| 2016 | $1,590 | $16,450 | $6,800 | $9,650 |
| 2015 | $1,533 | $16,450 | $6,800 | $9,650 |
| 2014 | $1,524 | $15,920 | $5,490 | $10,430 |
Source: Public Records
Map
Nearby Homes
- 312 Madison Ave
- 218 Euclid Ave
- 330 Lithia Ave
- 147 Euclid Ave
- 2918 Wingate Ct
- 617 N Elm Ave
- 426 W Kirkham Ave
- 615 Cornell Ave
- 621 Cornell Ave
- 9721 Greenwood Terrace
- 703 Holland Ave
- 546 Holland Ave
- 1013 Bell Ave
- 12 Berry Road Park
- 814 Holland Ave
- 701 W Kirkham Ave
- 136 E Waymire Ave
- 1146 Kortwright Ave
- 722 Glenvista Place
- 494 W Lockwood Ave
- 316 Euclid Ave
- 324 Euclid Ave
- 528 N Rock Hill Rd
- 312 Euclid Ave
- 310 Euclid Ave
- 323 Euclid Ave
- 319 Euclid Ave
- 317 Euclid Ave
- 529 N Rock Hill Rd
- 315 Euclid Ave
- 308 Euclid Ave
- 538 N Rock Hill Rd
- 313 Euclid Ave
- 535 N Rock Hill Rd
- 505 N Rock Hill Rd
- 404 Hazelgreen Dr
- 306 Euclid Ave
- 311 Euclid Ave
- 408 Hazelgreen Dr