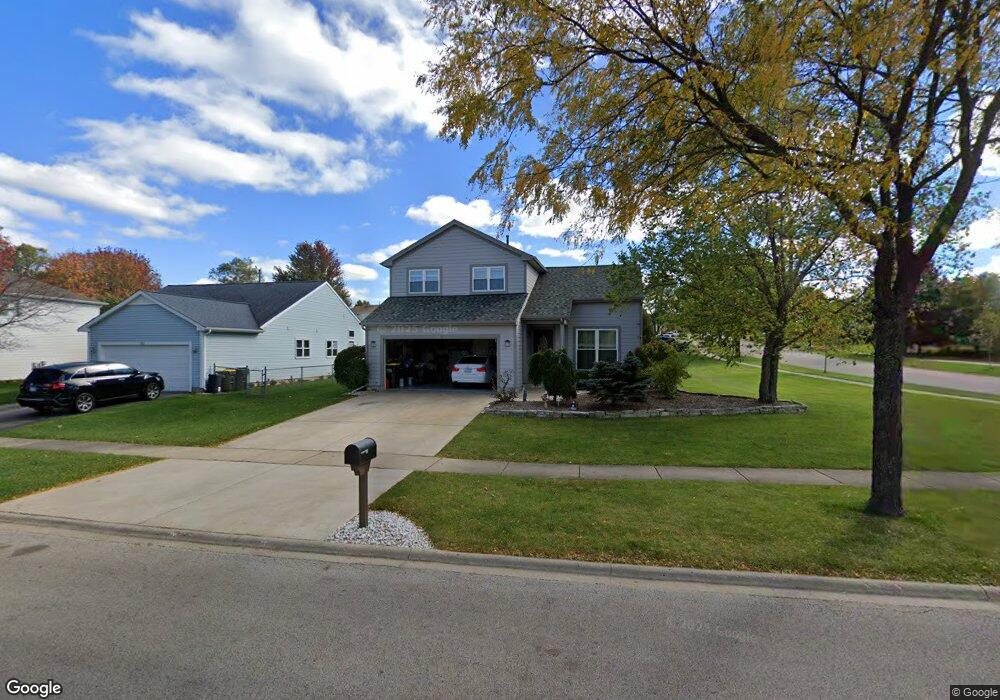
318 Harvest Gate Lake In the Hills, IL 60156
Estimated Value: $375,816 - $432,000
3
Beds
3
Baths
1,648
Sq Ft
$249/Sq Ft
Est. Value
About This Home
This home is located at 318 Harvest Gate, Lake In the Hills, IL 60156 and is currently estimated at $409,954, approximately $248 per square foot. 318 Harvest Gate is a home located in McHenry County with nearby schools including Westfield Community School, Lincoln Prairie Elementary School, and Harry D Jacobs High School.
Ownership History
Date
Name
Owned For
Owner Type
Purchase Details
Closed on
Nov 2, 2022
Sold by
Fabich Eugeniusz
Bought by
Eugeniusz Fabich Revocable Trust
Current Estimated Value
Purchase Details
Closed on
May 18, 1998
Sold by
Scardina John A
Bought by
Fabich Eugeniusz and Fabich Urszula
Home Financials for this Owner
Home Financials are based on the most recent Mortgage that was taken out on this home.
Original Mortgage
$145,250
Interest Rate
7.19%
Purchase Details
Closed on
May 4, 1995
Sold by
Steinhoff Britt S
Bought by
Scardina John A
Purchase Details
Closed on
Feb 1, 1994
Sold by
Harris Bank Hinsdale
Bought by
Scardina John A and Steinhoff Britt S
Home Financials for this Owner
Home Financials are based on the most recent Mortgage that was taken out on this home.
Original Mortgage
$153,676
Interest Rate
7.05%
Mortgage Type
FHA
Create a Home Valuation Report for This Property
The Home Valuation Report is an in-depth analysis detailing your home's value as well as a comparison with similar homes in the area
Home Values in the Area
Average Home Value in this Area
Purchase History
| Date | Buyer | Sale Price | Title Company |
|---|---|---|---|
| Eugeniusz Fabich Revocable Trust | -- | -- | |
| Fabich Eugeniusz | $161,500 | -- | |
| Scardina John A | -- | -- | |
| Scardina John A | $153,000 | -- |
Source: Public Records
Mortgage History
| Date | Status | Borrower | Loan Amount |
|---|---|---|---|
| Previous Owner | Fabich Eugeniusz | $145,250 | |
| Previous Owner | Scardina John A | $153,676 |
Source: Public Records
Tax History Compared to Growth
Tax History
| Year | Tax Paid | Tax Assessment Tax Assessment Total Assessment is a certain percentage of the fair market value that is determined by local assessors to be the total taxable value of land and additions on the property. | Land | Improvement |
|---|---|---|---|---|
| 2024 | $4,623 | $122,091 | $24,908 | $97,183 |
| 2023 | $8,014 | $109,195 | $22,277 | $86,918 |
| 2022 | $5,564 | $82,027 | $25,554 | $56,473 |
| 2021 | $6,482 | $76,418 | $23,807 | $52,611 |
| 2020 | $6,319 | $73,713 | $22,964 | $50,749 |
| 2019 | $6,187 | $70,552 | $21,979 | $48,573 |
| 2018 | $6,465 | $70,739 | $20,304 | $50,435 |
| 2017 | $6,333 | $66,641 | $19,128 | $47,513 |
| 2016 | $6,232 | $62,503 | $17,940 | $44,563 |
| 2013 | -- | $59,940 | $16,735 | $43,205 |
Source: Public Records
Map
Nearby Homes
- 206 Cool Stone Bend
- 202 Cool Stone Bend
- 432 Thunder Ridge
- 201 Northlight Passe
- 1 Clara Ct Unit 4
- 1171 Heartland Gate
- 4 Greenbrier Ct
- 2 Twelve Lakes Ct
- 7 Shoal Creek Ct
- 212 Village Creek Dr
- 1823 Somerfield Ln
- 15 W Oak St Unit 5
- 6 Sherwood Ct
- 16 Springbrook Ln
- 2801 Waterfront Ave
- 1740 Bradford Ln
- 4 Point o Woods Ct
- 187 Hilltop Dr
- 1724 Hartford Ln
- 1207 Crystal Lake Rd
- 316 Harvest Gate
- 162 Cool Stone Bend
- 314 Harvest Gate
- 400 Harvest Gate
- 164 Cool Stone Bend
- 317 Harvest Gate
- 312 Harvest Gate
- 315 Harvest Gate
- 166 Cool Stone Bend
- 215 Rainmaker Run
- 167 Cool Stone Bend
- 402 Harvest Gate
- 401 Harvest Gate
- 217 Rainmaker Run
- 313 Harvest Gate
- 213 Rainmaker Run
- 310 Harvest Gate
- 403 Harvest Gate
- 168 Cool Stone Bend
- 404 Harvest Gate