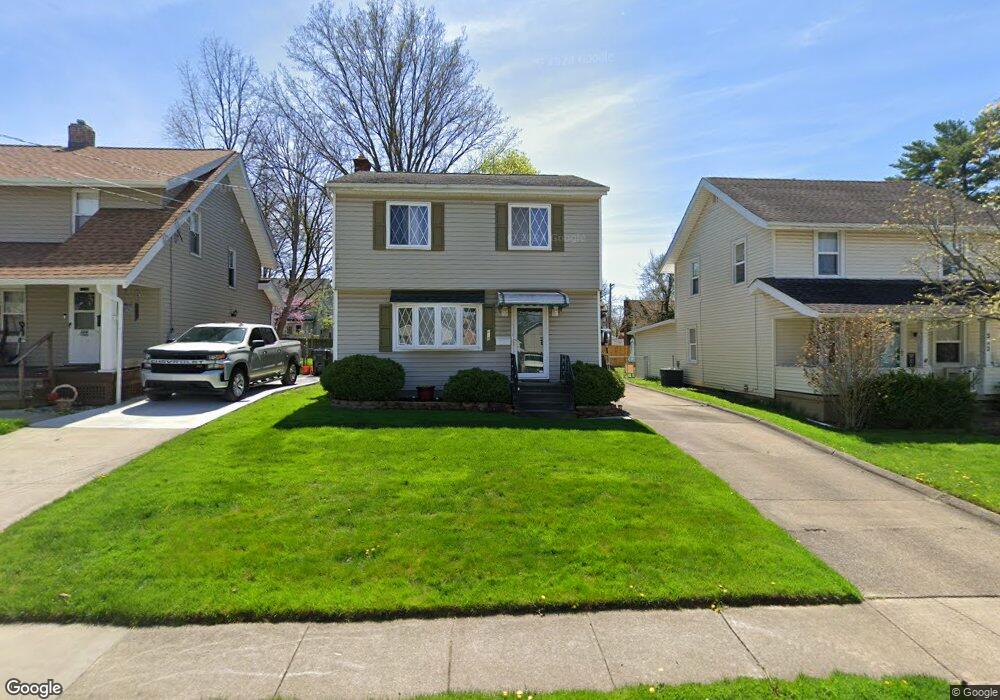
318 Kathron Ave Cuyahoga Falls, OH 44221
Mud Brook NeighborhoodEstimated Value: $187,000 - $237,000
3
Beds
2
Baths
1,248
Sq Ft
$167/Sq Ft
Est. Value
About This Home
This home is located at 318 Kathron Ave, Cuyahoga Falls, OH 44221 and is currently estimated at $207,934, approximately $166 per square foot. 318 Kathron Ave is a home located in Summit County with nearby schools including Lincoln Elementary School, Roberts Middle School, and Cuyahoga Falls High School.
Ownership History
Date
Name
Owned For
Owner Type
Purchase Details
Closed on
Sep 13, 2010
Sold by
Kondaur Capital Corporation
Bought by
Wodicka Donn R
Current Estimated Value
Home Financials for this Owner
Home Financials are based on the most recent Mortgage that was taken out on this home.
Original Mortgage
$110,992
Outstanding Balance
$73,329
Interest Rate
4.45%
Mortgage Type
FHA
Estimated Equity
$134,605
Purchase Details
Closed on
Apr 20, 2010
Sold by
Valentine Deborah A
Bought by
Kondaur Capital Corporation
Purchase Details
Closed on
Oct 28, 1997
Sold by
Locascio Nonda A
Bought by
Rowan James
Home Financials for this Owner
Home Financials are based on the most recent Mortgage that was taken out on this home.
Original Mortgage
$45,000
Interest Rate
7.65%
Mortgage Type
New Conventional
Create a Home Valuation Report for This Property
The Home Valuation Report is an in-depth analysis detailing your home's value as well as a comparison with similar homes in the area
Home Values in the Area
Average Home Value in this Area
Purchase History
| Date | Buyer | Sale Price | Title Company |
|---|---|---|---|
| Wodicka Donn R | $112,500 | Landcastle Title Llc | |
| Kondaur Capital Corporation | $76,000 | None Available | |
| Rowan James | $28,300 | -- |
Source: Public Records
Mortgage History
| Date | Status | Borrower | Loan Amount |
|---|---|---|---|
| Open | Wodicka Donn R | $110,992 | |
| Previous Owner | Rowan James | $45,000 |
Source: Public Records
Tax History Compared to Growth
Tax History
| Year | Tax Paid | Tax Assessment Tax Assessment Total Assessment is a certain percentage of the fair market value that is determined by local assessors to be the total taxable value of land and additions on the property. | Land | Improvement |
|---|---|---|---|---|
| 2025 | $2,610 | $48,349 | $9,170 | $39,179 |
| 2024 | $2,610 | $48,349 | $9,170 | $39,179 |
| 2023 | $2,610 | $48,349 | $9,170 | $39,179 |
| 2022 | $2,528 | $38,049 | $7,165 | $30,884 |
| 2021 | $2,528 | $38,049 | $7,165 | $30,884 |
| 2020 | $2,487 | $38,050 | $7,170 | $30,880 |
| 2019 | $2,653 | $36,970 | $7,170 | $29,800 |
| 2018 | $2,253 | $36,970 | $7,170 | $29,800 |
| 2017 | $2,050 | $36,970 | $7,170 | $29,800 |
| 2016 | $2,052 | $34,100 | $7,170 | $26,930 |
| 2015 | $2,050 | $34,100 | $7,170 | $26,930 |
| 2014 | $2,051 | $34,100 | $7,170 | $26,930 |
| 2013 | $2,334 | $39,130 | $7,170 | $31,960 |
Source: Public Records
Map
Nearby Homes
- 2886 Norwood St
- 455 Marguerite Ave
- 419 Keenan Ave
- 2890 Bailey Rd
- 2834 Norwood St
- 435 Roanoke Ave
- 2762 Bailey Rd
- 54 Washington Ave
- 218 Monroe Ave
- 306 Hollywood Ave
- 2693 Northland St
- 2711 Ironwood St
- 229 Hayes Ave
- 2736 Maplewood St
- 2762 Elmwood St
- 3320 Hudson Dr
- Greenfield Plan at Miller's Landing
- Riverton Plan at Miller's Landing
- Woodside Plan at Miller's Landing
- Willwood Plan at Miller's Landing
- 312 Kathron Ave
- 324 Kathron Ave
- 306 Kathron Ave
- 328 Kathron Ave
- 319 Marguerite Ave
- 325 Marguerite Ave
- 313 Marguerite Ave
- 300 Kathron Ave
- 307 Marguerite Ave
- 336 Kathron Ave
- 319 Kathron Ave
- 307 Kathron Ave
- 301 Marguerite Ave
- 331 Marguerite Ave
- 325 Kathron Ave
- 301 Kathron Ave
- 346 Kathron Ave
- 346 Kathron Ave
- 246 Kathron Ave
- 245 Marguerite Ave