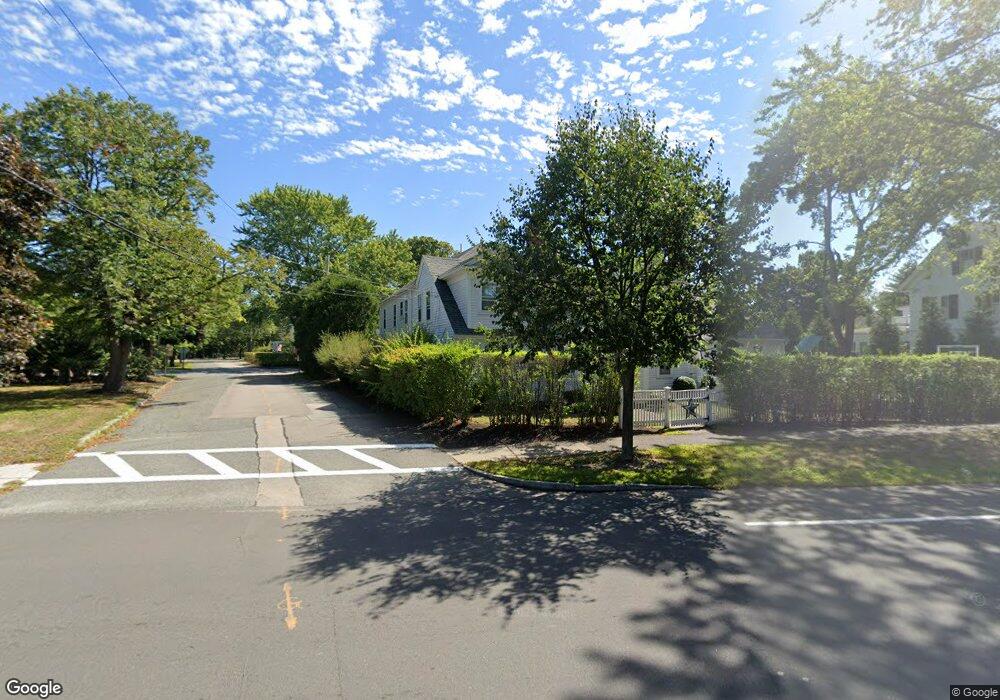
318 Main St Hingham, MA 02043
Estimated Value: $2,128,033 - $2,361,000
5
Beds
5
Baths
3,080
Sq Ft
$718/Sq Ft
Est. Value
About This Home
This home is located at 318 Main St, Hingham, MA 02043 and is currently estimated at $2,210,258, approximately $717 per square foot. 318 Main St is a home located in Plymouth County with nearby schools including East Elementary School, Hingham Middle School, and Hingham High School.
Ownership History
Date
Name
Owned For
Owner Type
Purchase Details
Closed on
Aug 2, 2017
Sold by
Prusty Sush
Bought by
Condelli Rachel L and Condelli Michael C
Current Estimated Value
Home Financials for this Owner
Home Financials are based on the most recent Mortgage that was taken out on this home.
Original Mortgage
$790,000
Outstanding Balance
$658,124
Interest Rate
3.9%
Mortgage Type
Unknown
Estimated Equity
$1,552,134
Purchase Details
Closed on
Oct 10, 2014
Sold by
Carolan 3Rd Alfred J and Carolan Sarah C
Bought by
Prusty Sush
Home Financials for this Owner
Home Financials are based on the most recent Mortgage that was taken out on this home.
Original Mortgage
$699,000
Interest Rate
4.1%
Mortgage Type
Purchase Money Mortgage
Purchase Details
Closed on
Nov 29, 2007
Sold by
Bennett Andrew B and Bennett Katherine A
Bought by
Carolan Alfred J and Carolan Sarah C
Home Financials for this Owner
Home Financials are based on the most recent Mortgage that was taken out on this home.
Original Mortgage
$575,000
Interest Rate
6.48%
Mortgage Type
Purchase Money Mortgage
Purchase Details
Closed on
Jun 13, 2002
Sold by
Meadowlands Rt and Marrone John M
Bought by
Bennett Andrew B and Bennett Katherine A
Home Financials for this Owner
Home Financials are based on the most recent Mortgage that was taken out on this home.
Original Mortgage
$500,000
Interest Rate
6.8%
Mortgage Type
Purchase Money Mortgage
Purchase Details
Closed on
Dec 5, 2000
Sold by
Est Macinnis Mary K and Singleton Daniel J
Bought by
Marrone John M
Home Financials for this Owner
Home Financials are based on the most recent Mortgage that was taken out on this home.
Original Mortgage
$400,000
Interest Rate
7.76%
Mortgage Type
Purchase Money Mortgage
Create a Home Valuation Report for This Property
The Home Valuation Report is an in-depth analysis detailing your home's value as well as a comparison with similar homes in the area
Purchase History
| Date | Buyer | Sale Price | Title Company |
|---|---|---|---|
| Condelli Rachel L | $1,215,000 | -- | |
| Prusty Sush | $999,000 | -- | |
| Carolan Alfred J | $875,000 | -- | |
| Bennett Andrew B | $930,000 | -- | |
| Marrone John M | $350,000 | -- |
Source: Public Records
Mortgage History
| Date | Status | Borrower | Loan Amount |
|---|---|---|---|
| Open | Condelli Rachel L | $790,000 | |
| Previous Owner | Prusty Sush | $699,000 | |
| Previous Owner | Marrone John M | $506,000 | |
| Previous Owner | Marrone John M | $575,000 | |
| Previous Owner | Marrone John M | $500,000 | |
| Previous Owner | Marrone John M | $400,000 |
Source: Public Records
Tax History
| Year | Tax Paid | Tax Assessment Tax Assessment Total Assessment is a certain percentage of the fair market value that is determined by local assessors to be the total taxable value of land and additions on the property. | Land | Improvement |
|---|---|---|---|---|
| 2025 | $18,102 | $1,693,400 | $758,500 | $934,900 |
| 2024 | $18,152 | $1,673,000 | $758,500 | $914,500 |
| 2023 | $16,445 | $1,644,500 | $758,500 | $886,000 |
| 2022 | $16,401 | $1,418,800 | $689,600 | $729,200 |
| 2021 | $13,773 | $1,167,200 | $651,300 | $515,900 |
| 2020 | $13,458 | $1,167,200 | $651,300 | $515,900 |
| 2019 | $13,676 | $1,158,000 | $651,300 | $506,700 |
| 2018 | $13,452 | $1,142,900 | $651,300 | $491,600 |
| 2017 | $11,820 | $964,900 | $554,100 | $410,800 |
| 2016 | $11,723 | $938,600 | $527,800 | $410,800 |
| 2015 | $11,822 | $943,500 | $519,400 | $424,100 |
Source: Public Records
Map
Nearby Homes
Your Personal Tour Guide
Ask me questions while you tour the home.