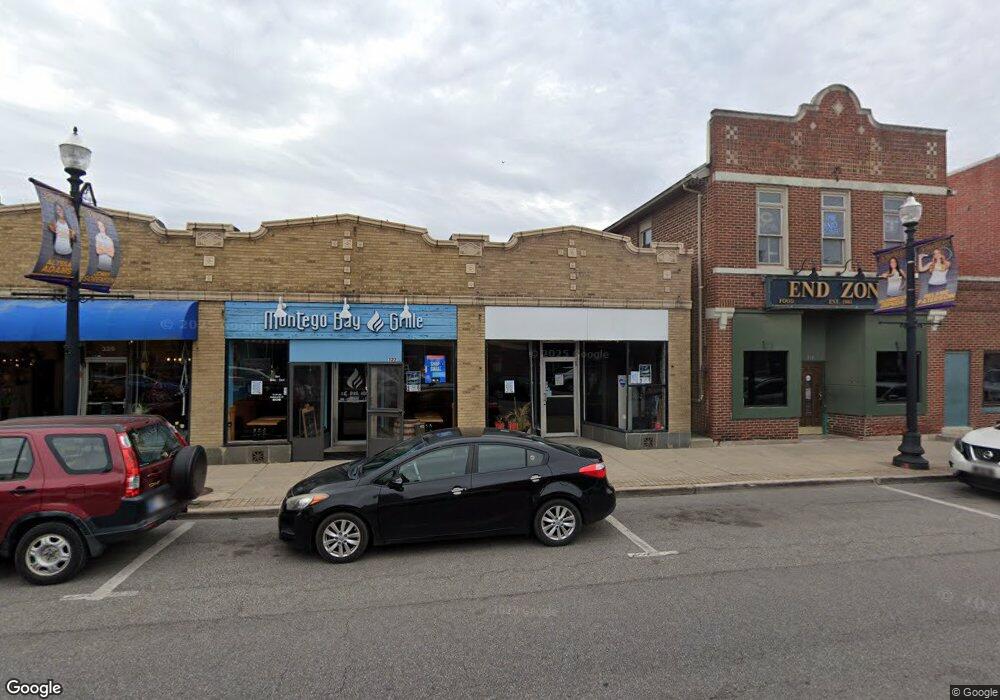
318 Main St Hobart, IN 46342
--
Bed
--
Bath
4,520
Sq Ft
4,356
Sq Ft Lot
About This Home
This home is located at 318 Main St, Hobart, IN 46342. 318 Main St is a home located in Lake County with nearby schools including Hobart High School.
Ownership History
Date
Name
Owned For
Owner Type
Purchase Details
Closed on
May 3, 2021
Sold by
Vansanten Jerry B and Vansanten Van Santen
Bought by
Hobart Holdings Llc
Home Financials for this Owner
Home Financials are based on the most recent Mortgage that was taken out on this home.
Original Mortgage
$342,000
Outstanding Balance
$309,453
Interest Rate
3%
Mortgage Type
Purchase Money Mortgage
Purchase Details
Closed on
Apr 27, 2021
Sold by
Vansanten Jerry B and Vansanten Van Santen
Bought by
Hobart Holdings Llc
Home Financials for this Owner
Home Financials are based on the most recent Mortgage that was taken out on this home.
Original Mortgage
$342,000
Outstanding Balance
$309,453
Interest Rate
3%
Mortgage Type
Purchase Money Mortgage
Create a Home Valuation Report for This Property
The Home Valuation Report is an in-depth analysis detailing your home's value as well as a comparison with similar homes in the area
Home Values in the Area
Average Home Value in this Area
Purchase History
| Date | Buyer | Sale Price | Title Company |
|---|---|---|---|
| Hobart Holdings Llc | $300,000 | Mtc | |
| Hobart Holdings Llc | -- | Meridian Title |
Source: Public Records
Mortgage History
| Date | Status | Borrower | Loan Amount |
|---|---|---|---|
| Open | Hobart Holdings Llc | $342,000 | |
| Closed | Hobart Holdings Llc | $342,000 |
Source: Public Records
Tax History Compared to Growth
Tax History
| Year | Tax Paid | Tax Assessment Tax Assessment Total Assessment is a certain percentage of the fair market value that is determined by local assessors to be the total taxable value of land and additions on the property. | Land | Improvement |
|---|---|---|---|---|
| 2024 | $11,773 | $294,100 | $16,900 | $277,200 |
| 2023 | $10,133 | $288,400 | $16,900 | $271,500 |
| 2022 | $10,133 | $299,400 | $16,900 | $282,500 |
| 2021 | $9,486 | $279,700 | $16,900 | $262,800 |
| 2020 | $9,040 | $275,600 | $16,900 | $258,700 |
| 2019 | $8,951 | $267,300 | $16,900 | $250,400 |
| 2018 | $8,750 | $258,900 | $16,900 | $242,000 |
| 2017 | $8,317 | $243,200 | $16,900 | $226,300 |
| 2016 | $7,710 | $239,100 | $16,900 | $222,200 |
| 2014 | $3,132 | $100,500 | $16,900 | $83,600 |
| 2013 | $3,125 | $100,000 | $16,900 | $83,100 |
Source: Public Records
Map
Nearby Homes