Estimated Value: $239,490 - $272,000
3
Beds
2
Baths
1,454
Sq Ft
$175/Sq Ft
Est. Value
About This Home
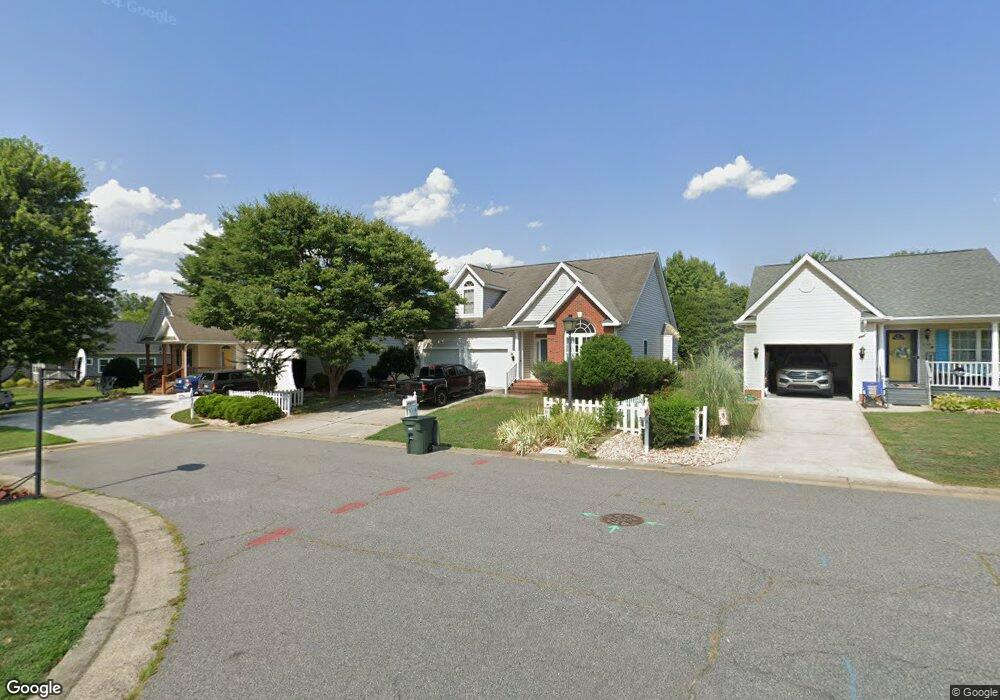
This home is located at 318 Meadowview Ln, Eden, NC 27288 and is currently estimated at $255,123, approximately $175 per square foot. 318 Meadowview Ln is a home located in Rockingham County with nearby schools including Central Elementary School, J.E. Holmes Middle School, and John M. Morehead High School.
Ownership History
Date
Name
Owned For
Owner Type
Purchase Details
Closed on
Mar 22, 2012
Sold by
The Bank Of New York Mellon
Bought by
Wilbourne John A and Wilbourne Lynn H
Current Estimated Value
Home Financials for this Owner
Home Financials are based on the most recent Mortgage that was taken out on this home.
Original Mortgage
$99,100
Interest Rate
3.88%
Mortgage Type
New Conventional
Purchase Details
Closed on
Dec 22, 2011
Sold by
Benthin Florence
Bought by
The Bank Of New York Mellon and The Bank Of New York
Purchase Details
Closed on
Apr 22, 2005
Sold by
Wright Co Of N C Inc
Bought by
Benthin Florence A
Home Financials for this Owner
Home Financials are based on the most recent Mortgage that was taken out on this home.
Original Mortgage
$124,110
Interest Rate
5.79%
Mortgage Type
New Conventional
Create a Home Valuation Report for This Property
The Home Valuation Report is an in-depth analysis detailing your home's value as well as a comparison with similar homes in the area
Home Values in the Area
Average Home Value in this Area
Purchase History
| Date | Buyer | Sale Price | Title Company |
|---|---|---|---|
| Wilbourne John A | $124,000 | None Available | |
| The Bank Of New York Mellon | $650,000 | None Available | |
| Benthin Florence A | $138,000 | None Available |
Source: Public Records
Mortgage History
| Date | Status | Borrower | Loan Amount |
|---|---|---|---|
| Previous Owner | Wilbourne John A | $99,100 | |
| Previous Owner | Benthin Florence A | $124,110 |
Source: Public Records
Tax History
| Year | Tax Paid | Tax Assessment Tax Assessment Total Assessment is a certain percentage of the fair market value that is determined by local assessors to be the total taxable value of land and additions on the property. | Land | Improvement |
|---|---|---|---|---|
| 2025 | $2,367 | $215,198 | $11,000 | $204,198 |
| 2024 | $2,367 | $215,198 | $11,000 | $204,198 |
| 2023 | $2,367 | $130,759 | $10,000 | $120,759 |
| 2022 | $1,705 | $130,759 | $10,000 | $120,759 |
| 2021 | $1,705 | $130,759 | $10,000 | $120,759 |
| 2020 | $1,705 | $130,759 | $10,000 | $120,759 |
| 2019 | $1,705 | $130,759 | $10,000 | $120,759 |
| 2018 | $1,718 | $131,635 | $18,500 | $113,135 |
| 2017 | $1,718 | $131,635 | $18,500 | $113,135 |
| 2015 | $1,735 | $131,635 | $18,500 | $113,135 |
| 2014 | -- | $131,635 | $18,500 | $113,135 |
Source: Public Records
Map
Nearby Homes
- 308 Walter Chambers St
- 343 Pervie Bolick St
- 148 E Meadow Rd
- 700 John St
- 626 Creekridge Dr
- 0 N Carolina 14
- 621 North St
- 216 Roosevelt St
- 138 Devonway St
- 222 S Edgewood Rd
- 607 Truman St
- 737 Summit Rd
- 729 Cypress Hill Dr
- 715 Meadowgreen Village Dr
- 719 Meadowgreen Village Dr
- 826 Summit Rd
- 716 Meadowgreen Village Dr Unit 4A
- 739 Meadowgreen Village Dr
- 741 Meadowgreen Village Dr
- 800 Chatham Ct
- 316 Meadowview Ln
- 320 Meadowview Ln
- 314 Meadowview Ln
- 315 Meadowview Ln
- 312 Meadowview Ln
- 403 Clover Ct
- 326 Poppy Ct
- 311 Meadowview Ln
- 308 Meadowview Ln
- 328 Poppy Ct
- 326 Frank Cherry St
- 402 Daisy Ct
- 309 Meadowview Ln
- 400 Clover Ct
- 306 Meadowview Ln
- 330 Poppy Ct
- 307 Meadowview Ln
- 304 Meadowview Ln
- 403 Heather Ct
- 401 Daisy Ct
Your Personal Tour Guide
Ask me questions while you tour the home.