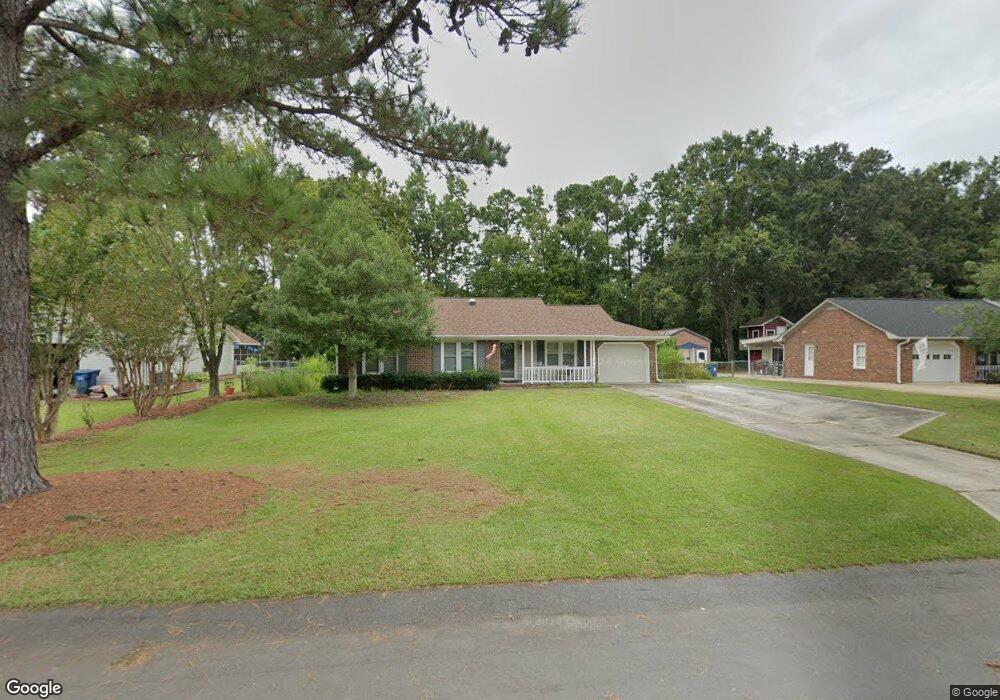
318 N Hampton Rd Wilmington, NC 28409
Lansdowne NeighborhoodEstimated Value: $377,639 - $426,000
3
Beds
2
Baths
1,348
Sq Ft
$299/Sq Ft
Est. Value
About This Home
This home is located at 318 N Hampton Rd, Wilmington, NC 28409 and is currently estimated at $403,660, approximately $299 per square foot. 318 N Hampton Rd is a home located in New Hanover County with nearby schools including Holly Tree Elementary School, Roland-Grise Middle School, and John T. Hoggard High School.
Ownership History
Date
Name
Owned For
Owner Type
Purchase Details
Closed on
Jan 9, 2021
Sold by
Cratty James Ray and Cratty Nancy Elizabeth
Bought by
Cratty Susan Arlene
Current Estimated Value
Purchase Details
Closed on
Feb 18, 2002
Sold by
Blackley William F Katherine E
Bought by
Cratty James Ray
Purchase Details
Closed on
Oct 27, 1998
Sold by
Blackley William F
Bought by
Blackley William F
Purchase Details
Closed on
Oct 10, 1991
Sold by
Moylette Walter J Olivia
Bought by
Blackley William F
Purchase Details
Closed on
Mar 1, 1988
Sold by
Crafts Richard L Linda C
Bought by
Moylette Walter J Olivia
Purchase Details
Closed on
Aug 1, 1984
Sold by
I L Smith Const Co Inc
Bought by
Crafts Richard L Linda C
Purchase Details
Closed on
Sep 1, 1983
Sold by
Preferred Prop Of Wilm Inc
Bought by
I L Smith Const Co Inc
Purchase Details
Closed on
May 1, 1980
Bought by
Preferred Prop Of Wilm Inc
Create a Home Valuation Report for This Property
The Home Valuation Report is an in-depth analysis detailing your home's value as well as a comparison with similar homes in the area
Home Values in the Area
Average Home Value in this Area
Purchase History
| Date | Buyer | Sale Price | Title Company |
|---|---|---|---|
| Cratty Susan Arlene | -- | None Available | |
| Crafty Susan Arlene | -- | None Listed On Document | |
| Cratty James Ray | $121,500 | -- | |
| Blackley William F | -- | -- | |
| Blackley William F | $75,000 | -- | |
| Moylette Walter J Olivia | $70,000 | -- | |
| Crafts Richard L Linda C | $69,500 | -- | |
| I L Smith Const Co Inc | $9,500 | -- | |
| Preferred Prop Of Wilm Inc | -- | -- |
Source: Public Records
Tax History Compared to Growth
Tax History
| Year | Tax Paid | Tax Assessment Tax Assessment Total Assessment is a certain percentage of the fair market value that is determined by local assessors to be the total taxable value of land and additions on the property. | Land | Improvement |
|---|---|---|---|---|
| 2024 | $2,091 | $240,400 | $79,000 | $161,400 |
| 2023 | $2,091 | $240,400 | $79,000 | $161,400 |
| 2022 | $1,022 | $240,400 | $79,000 | $161,400 |
| 2021 | $1,029 | $240,400 | $79,000 | $161,400 |
| 2020 | $2,009 | $190,700 | $55,000 | $135,700 |
| 2019 | $2,009 | $190,700 | $55,000 | $135,700 |
| 2018 | $2,009 | $190,700 | $55,000 | $135,700 |
| 2017 | $2,009 | $190,700 | $55,000 | $135,700 |
| 2016 | $1,705 | $153,900 | $49,500 | $104,400 |
| 2015 | $1,630 | $153,900 | $49,500 | $104,400 |
| 2014 | $1,561 | $153,900 | $49,500 | $104,400 |
Source: Public Records
Map
Nearby Homes
- 101 Doughton Dr
- 106 Brookview Rd
- 736 Kelly Rd
- 125 N Hampton Rd
- 3556 Iris St
- 531 Commons Way
- 3629 Sutton Dr
- 652 Chowning Place
- 517 Kelly Rd
- 623 Barksdale Rd
- 601 Colony Cir N
- 3405 Aster Ct
- 508 Commons Way
- 439 Kelly Rd
- 3863 Daphine Ct
- 800 Deer Haven Ct
- 5029 Monck Ct
- 1008 Sabal Ct
- 716 Benchmark Ct
- 3004 Wickford Rd
- 316 N Hampton Rd
- 320 N Hampton Rd
- 322 N Hampton Rd
- 126 S Colony Cir
- 314 N Hampton Rd
- 130 S Colony Cir
- 122 S Colony Cir
- 315 N Hampton Rd
- 313 N Hampton Rd
- 134 S Colony Cir
- 118 S Colony Cir
- 324 N Hampton Rd
- 312 N Hampton Rd
- 317 N Hampton Rd
- 311 N Hampton Rd
- 138 S Colony Cir
- 114 S Colony Cir
- 319 N Hampton Rd
- 309 N Hampton Rd
- 310 N Hampton Rd