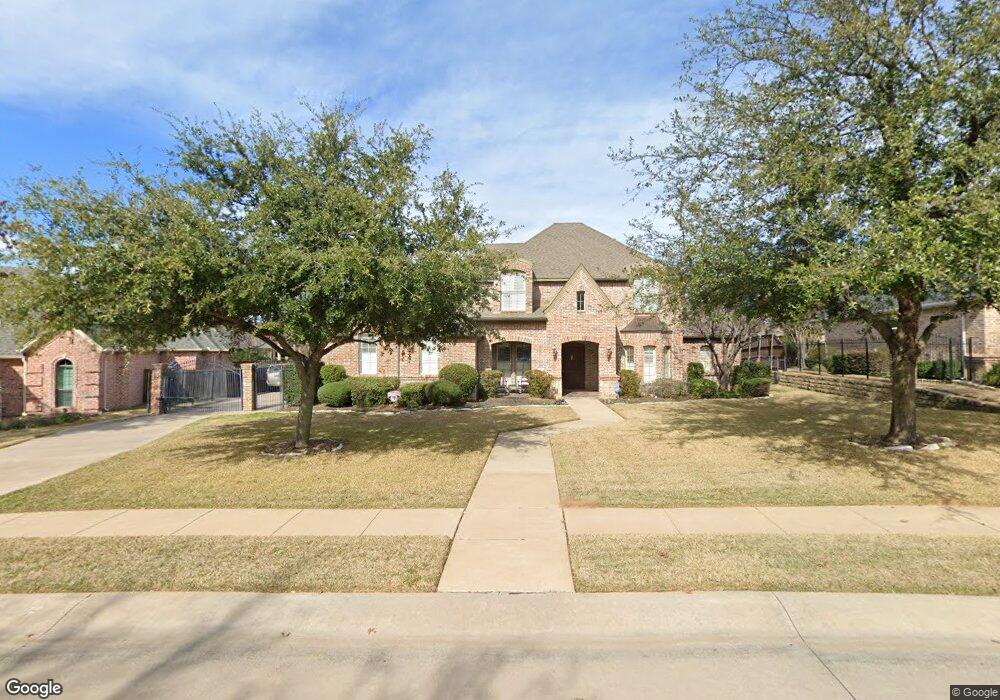
318 Oaklawn Dr Colleyville, TX 76034
Estimated Value: $1,095,000 - $1,275,000
5
Beds
4
Baths
4,068
Sq Ft
$290/Sq Ft
Est. Value
About This Home
This home is located at 318 Oaklawn Dr, Colleyville, TX 76034 and is currently estimated at $1,179,052, approximately $289 per square foot. 318 Oaklawn Dr is a home located in Tarrant County with nearby schools including Liberty Elementary School, Bear Creek Intermediate School, and Keller Middle School.
Ownership History
Date
Name
Owned For
Owner Type
Purchase Details
Closed on
Jan 15, 2019
Sold by
Pulido Jamie and Pulido George
Bought by
Harris Brandon K and Harris Desiree A
Current Estimated Value
Home Financials for this Owner
Home Financials are based on the most recent Mortgage that was taken out on this home.
Original Mortgage
$616,431
Outstanding Balance
$543,063
Interest Rate
4.7%
Mortgage Type
Purchase Money Mortgage
Estimated Equity
$635,989
Purchase Details
Closed on
Nov 7, 2011
Sold by
Ford Jamie
Bought by
Ford Jamie
Purchase Details
Closed on
Oct 17, 2000
Sold by
Panorama Properties Inc
Bought by
Ford William and Ford Jamie
Home Financials for this Owner
Home Financials are based on the most recent Mortgage that was taken out on this home.
Original Mortgage
$342,336
Interest Rate
8.62%
Create a Home Valuation Report for This Property
The Home Valuation Report is an in-depth analysis detailing your home's value as well as a comparison with similar homes in the area
Home Values in the Area
Average Home Value in this Area
Purchase History
| Date | Buyer | Sale Price | Title Company |
|---|---|---|---|
| Harris Brandon K | -- | Texas Secure Title Co | |
| Ford Jamie | -- | None Available | |
| Ford William | -- | Commonwealth Land Title |
Source: Public Records
Mortgage History
| Date | Status | Borrower | Loan Amount |
|---|---|---|---|
| Open | Harris Brandon K | $616,431 | |
| Previous Owner | Ford William | $342,336 |
Source: Public Records
Tax History Compared to Growth
Tax History
| Year | Tax Paid | Tax Assessment Tax Assessment Total Assessment is a certain percentage of the fair market value that is determined by local assessors to be the total taxable value of land and additions on the property. | Land | Improvement |
|---|---|---|---|---|
| 2025 | $13,808 | $1,025,629 | $201,050 | $824,579 |
| 2024 | $13,808 | $1,025,629 | $201,050 | $824,579 |
| 2023 | $16,780 | $1,050,655 | $201,050 | $849,605 |
| 2022 | $19,227 | $908,146 | $201,050 | $707,096 |
| 2021 | $17,152 | $749,767 | $200,000 | $549,767 |
| 2020 | $16,587 | $720,006 | $200,000 | $520,006 |
| 2019 | $17,389 | $751,196 | $200,000 | $551,196 |
| 2018 | $13,340 | $651,820 | $150,000 | $501,820 |
| 2017 | $16,025 | $644,663 | $150,000 | $494,663 |
| 2016 | $14,902 | $618,800 | $150,000 | $468,800 |
| 2015 | $13,597 | $545,000 | $65,000 | $480,000 |
| 2014 | $13,597 | $545,000 | $65,000 | $480,000 |
Source: Public Records
Map
Nearby Homes
- 203 Polo Trail
- 6776 St Moritz Pkwy
- 6004 Hunter Ct
- 803 Marie Dr
- 6108 Westcoat Dr
- 6401 Westcoat Dr
- 613 Colts Neck Ct
- 5800 Hunter Trail
- 6112 Emmas Ct
- 204 Old Grove Rd
- 5803 Chalford Common
- 1010 W Mcdonwell School Rd
- 200 Valley View Dr N
- 912 Chateau Ct
- 5913 Preston Way
- 5902 Preston Way
- 6809 Strauss
- 5918 Crescent Ln
- 5903 Crescent Ln
- 6912 Handel
- 322 Oaklawn Dr
- 314 Oaklawn Dr
- 319 Polo Trail
- 6403 Champion Way
- 317 Oaklawn Dr
- 315 Polo Trail
- 310 Oaklawn Dr
- 313 Oaklawn Dr
- 6411 Champion Way
- 400 Polo Ct
- 6300 Remington Pkwy
- 311 Polo Trail
- 309 Oaklawn Dr
- 306 Oaklawn Dr
- 404 Polo Ct
- 307 Polo Trail
- 6205 Remington Pkwy
- 316 Polo Trail
- 6406 Champion Way
- 305 Oaklawn Dr