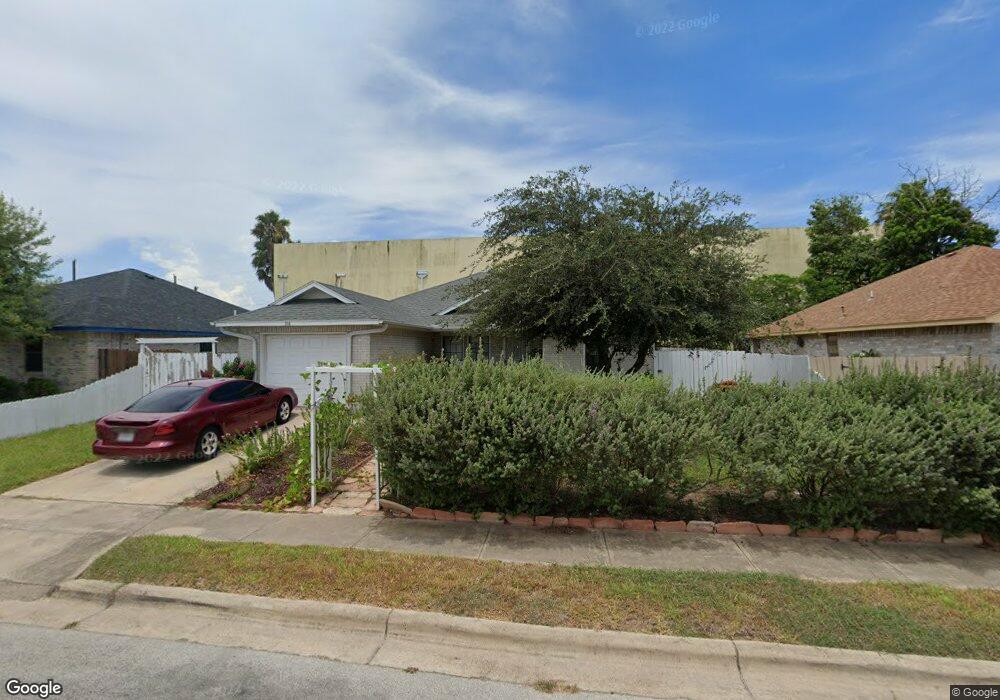
318 Old Stadium Dr Port Isabel, TX 78578
Estimated Value: $199,656 - $290,000
--
Bed
--
Bath
1,162
Sq Ft
$204/Sq Ft
Est. Value
About This Home
This home is located at 318 Old Stadium Dr, Port Isabel, TX 78578 and is currently estimated at $237,414, approximately $204 per square foot. 318 Old Stadium Dr is a home located in Cameron County with nearby schools including Garriga Elementary School, Derry Elementary School, and Port Isabel Junior High School.
Ownership History
Date
Name
Owned For
Owner Type
Purchase Details
Closed on
Jun 11, 2007
Sold by
Hud
Bought by
Kerkow Daniel Lloyd and Kerkow Maria Ines
Current Estimated Value
Home Financials for this Owner
Home Financials are based on the most recent Mortgage that was taken out on this home.
Original Mortgage
$71,200
Outstanding Balance
$43,472
Interest Rate
6.15%
Mortgage Type
Purchase Money Mortgage
Estimated Equity
$193,942
Purchase Details
Closed on
Feb 20, 2006
Sold by
Bank Of New York
Bought by
Hud
Purchase Details
Closed on
Jan 3, 2006
Sold by
Vargas Evangelina and Vargas Jorge G
Bought by
Bank Of New York
Purchase Details
Closed on
Mar 20, 2000
Sold by
Community Development Corp Brownsville
Bought by
Vargas Jorge G and Vargas Evangelina
Home Financials for this Owner
Home Financials are based on the most recent Mortgage that was taken out on this home.
Original Mortgage
$57,950
Interest Rate
6.95%
Mortgage Type
Seller Take Back
Create a Home Valuation Report for This Property
The Home Valuation Report is an in-depth analysis detailing your home's value as well as a comparison with similar homes in the area
Home Values in the Area
Average Home Value in this Area
Purchase History
| Date | Buyer | Sale Price | Title Company |
|---|---|---|---|
| Kerkow Daniel Lloyd | -- | First American Title Ins Co | |
| Hud | -- | None Available | |
| Bank Of New York | $58,702 | None Available | |
| Vargas Jorge G | -- | -- |
Source: Public Records
Mortgage History
| Date | Status | Borrower | Loan Amount |
|---|---|---|---|
| Open | Kerkow Daniel Lloyd | $71,200 | |
| Previous Owner | Vargas Jorge G | $57,950 | |
| Closed | Vargas Jorge G | $10,000 |
Source: Public Records
Tax History Compared to Growth
Tax History
| Year | Tax Paid | Tax Assessment Tax Assessment Total Assessment is a certain percentage of the fair market value that is determined by local assessors to be the total taxable value of land and additions on the property. | Land | Improvement |
|---|---|---|---|---|
| 2025 | -- | $112,776 | -- | -- |
| 2024 | -- | $102,524 | -- | -- |
| 2023 | $2,025 | $93,204 | $0 | $0 |
| 2022 | $1,952 | $84,731 | $38,504 | $46,227 |
| 2021 | $2,045 | $85,287 | $38,504 | $46,783 |
| 2020 | $2,070 | $85,839 | $38,504 | $47,335 |
| 2019 | $2,205 | $92,826 | $24,348 | $68,478 |
| 2018 | $2,178 | $91,729 | $24,348 | $67,381 |
| 2017 | $2,209 | $93,270 | $24,348 | $68,922 |
| 2016 | $2,118 | $94,043 | $24,348 | $69,695 |
| 2015 | -- | $81,288 | $24,348 | $56,940 |
Source: Public Records
Map
Nearby Homes
- 909 Trout Ave
- 1001 Trout Ave
- 401 Island Ave Unit 71A
- 401 Island Ave Unit 70-A
- 401 Island Ave Unit 63-A
- TBD Anne Bonnie Unit 4
- 233 Anne Bonny
- LOT 2 Jean Lafitte Unit 2
- 0 Jean Lafitte Unit 3 29767794
- Lot 3 Jean Lafitte Unit 3
- n/a Capt Kidd Unit 16
- 0 Capt Kidd Unit 475855
- 1108 Bass Ave
- Lot 23 Bass Ave
- 0 Bass Ave Unit 38 100189
- 0 Bass Ave Unit 467130
- 917 Pompano Ave
- 0 Pompano Ave Unit 2 103128
- 1218 Bass Ave
- 1578 Harbor Island Dr
- 314 Old Stadium Dr
- 322 Old Stadium Dr
- 310 Old Stadium Dr
- 326 Old Stadium Dr
- 803 Texas 100
- 803 Texas 100
- 803 State Highway 100 Unit B and C
- 803 State Highway 100
- 321 Old Stadium Dr
- 325 Old Stadium Dr
- 317 Old Stadium Dr
- 306 Old Stadium Dr
- 409 Old Stadium Dr
- 313 Old Stadium Dr
- 402 Old Stadium Dr
- 309 Old Stadium Dr
- 417 Old Stadium Dr
- 302 Old Stadium Dr
- 305 Old Stadium Dr
- 406 Old Stadium Dr