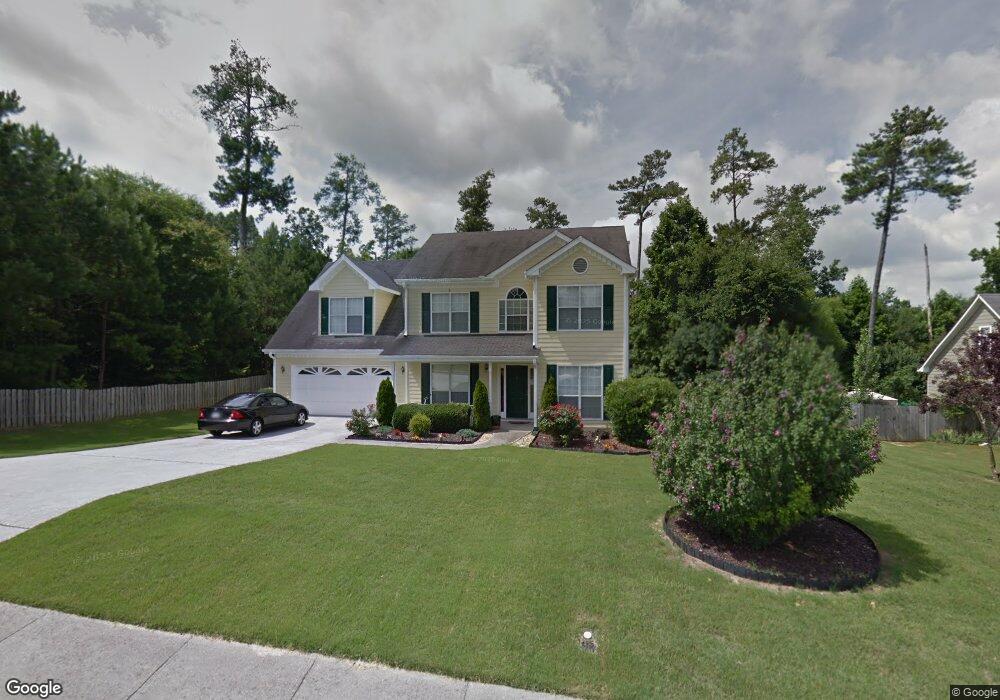
318 Pebblestone Dr Loganville, GA 30052
Estimated Value: $338,000 - $364,795
4
Beds
3
Baths
2,493
Sq Ft
$142/Sq Ft
Est. Value
About This Home
This home is located at 318 Pebblestone Dr, Loganville, GA 30052 and is currently estimated at $354,949, approximately $142 per square foot. 318 Pebblestone Dr is a home located in Gwinnett County with nearby schools including Magill Elementary School, Grace Snell Middle School, and South Gwinnett High School.
Ownership History
Date
Name
Owned For
Owner Type
Purchase Details
Closed on
Mar 2, 2011
Sold by
Torres Eugene and Torres Deloris
Bought by
Sinclair Marcel and Sinclair Jacynth
Current Estimated Value
Home Financials for this Owner
Home Financials are based on the most recent Mortgage that was taken out on this home.
Original Mortgage
$77,972
Outstanding Balance
$2,364
Interest Rate
4.5%
Mortgage Type
FHA
Estimated Equity
$352,585
Purchase Details
Closed on
Jul 13, 2007
Sold by
Fusco Thomas P and Fusco Virginia A
Bought by
Torres Eugene and Torres Deloris
Home Financials for this Owner
Home Financials are based on the most recent Mortgage that was taken out on this home.
Original Mortgage
$55,000
Interest Rate
6.37%
Mortgage Type
New Conventional
Purchase Details
Closed on
Aug 1, 1997
Sold by
Shm Homes Inc
Bought by
Fusco Thomas P and Fusco Virginia A
Home Financials for this Owner
Home Financials are based on the most recent Mortgage that was taken out on this home.
Original Mortgage
$119,400
Interest Rate
7.59%
Mortgage Type
New Conventional
Create a Home Valuation Report for This Property
The Home Valuation Report is an in-depth analysis detailing your home's value as well as a comparison with similar homes in the area
Home Values in the Area
Average Home Value in this Area
Purchase History
| Date | Buyer | Sale Price | Title Company |
|---|---|---|---|
| Sinclair Marcel | $80,000 | -- | |
| Torres Eugene | $165,000 | -- | |
| Fusco Thomas P | $125,700 | -- |
Source: Public Records
Mortgage History
| Date | Status | Borrower | Loan Amount |
|---|---|---|---|
| Open | Sinclair Marcel | $77,972 | |
| Previous Owner | Torres Eugene | $55,000 | |
| Previous Owner | Fusco Thomas P | $119,400 |
Source: Public Records
Tax History
| Year | Tax Paid | Tax Assessment Tax Assessment Total Assessment is a certain percentage of the fair market value that is determined by local assessors to be the total taxable value of land and additions on the property. | Land | Improvement |
|---|---|---|---|---|
| 2025 | $4,326 | $152,320 | $30,000 | $122,320 |
| 2024 | $4,143 | $143,840 | $30,000 | $113,840 |
| 2023 | $4,143 | $151,640 | $29,680 | $121,960 |
| 2022 | $3,816 | $132,040 | $22,000 | $110,040 |
| 2021 | $2,837 | $95,840 | $14,000 | $81,840 |
| 2020 | $2,745 | $91,960 | $14,000 | $77,960 |
| 2019 | $2,425 | $81,480 | $12,000 | $69,480 |
| 2018 | $2,342 | $78,320 | $12,000 | $66,320 |
| 2016 | $1,987 | $66,520 | $8,000 | $58,520 |
| 2015 | $1,645 | $54,240 | $8,000 | $46,240 |
| 2014 | -- | $54,240 | $8,000 | $46,240 |
Source: Public Records
Map
Nearby Homes
- 310 Pebblestone Dr
- 232 Rockingham Dr
- 415 Crested View Dr
- 900 Willow Springs Ct
- 4310 Perrinton Trail
- 750 Old Loganville Rd SW
- 4255 Willow Springs Dr
- 716 Manor Ridge Dr Unit 1
- 1035 Brushystone Dr
- 879 Spring Oak Ct
- 910 Lakeside Ct
- 5155 Donald Dr
- 4523 Grove Lake St
- 4323 Grove Lake St
- 4204 Logans Bluff Unit 2
- 443 Rhett Dr
- 433 Rhett Dr
- 514 Bradford Park Ct Unit 6
- 1291 Tumblerock Ct
- 737 Wilkes Dr
- 320 Pebblestone Dr
- 432 Crested View Dr
- 430 Crested View Dr Unit 1
- 609 Crested
- 609 Crested View Ct
- 322 Pebblestone Dr
- 608 Crested View Ct
- 428 Crested View Dr
- 319 Pebblestone Dr
- 317 Pebblestone Dr
- 426 Crested View Dr
- 321 Pebblestone Dr
- 324 Pebblestone Dr
- 436 Crested View Dr
- 605 Crested View Ct Unit 160
- 605 Crested View Ct
- 605 Crested View Ct
- 424 Crested View Dr
- 604 Crested View Ct Unit 604
- 604 Crested View Ct
Your Personal Tour Guide
Ask me questions while you tour the home.