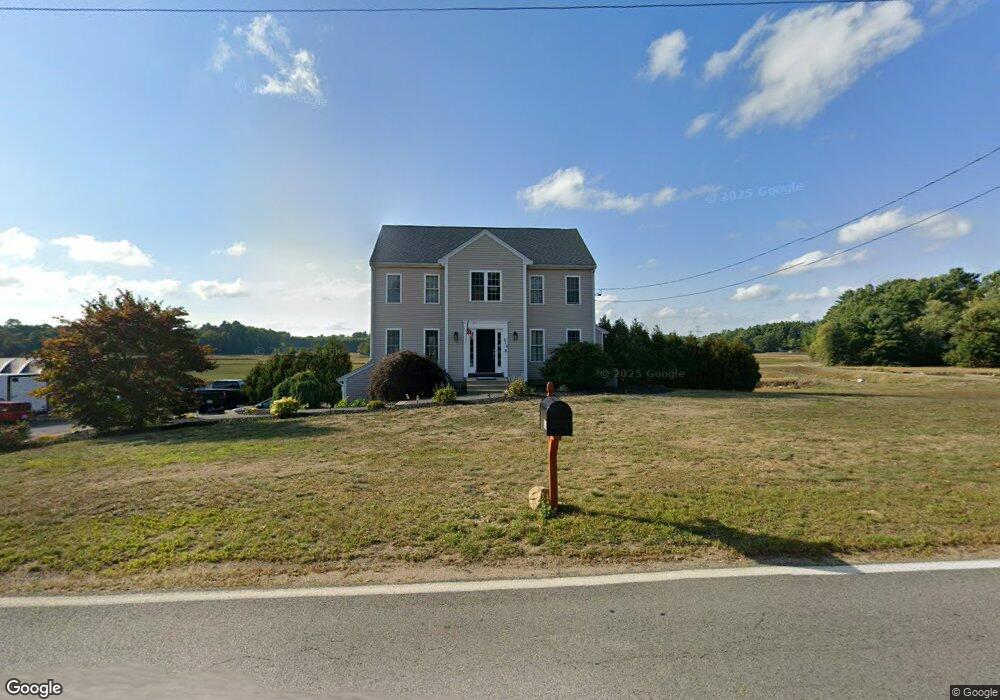
318 Purchase St Unit 8 Middleboro, MA 02346
Estimated Value: $684,013
3
Beds
3
Baths
1,872
Sq Ft
$365/Sq Ft
Est. Value
About This Home
This home is located at 318 Purchase St Unit 8, Middleboro, MA 02346 and is currently estimated at $684,013, approximately $365 per square foot. 318 Purchase St Unit 8 is a home located in Plymouth County with nearby schools including Mary K. Goode Elementary School and Samuel Fuller School.
Ownership History
Date
Name
Owned For
Owner Type
Purchase Details
Closed on
Nov 28, 2020
Sold by
Viveiros Ana P
Bought by
Viveiros Ana P
Current Estimated Value
Purchase Details
Closed on
Jan 30, 2015
Sold by
Correia Francisco V
Bought by
Ramirez Fausto
Home Financials for this Owner
Home Financials are based on the most recent Mortgage that was taken out on this home.
Original Mortgage
$261,484
Interest Rate
3.81%
Mortgage Type
Commercial
Purchase Details
Closed on
Nov 5, 2012
Sold by
Correia Francisco V and Correia Ana D
Bought by
Correia Francisco V
Purchase Details
Closed on
Feb 22, 2011
Sold by
Blais Builders Inc
Bought by
Correia Francisco V and Correia Ana D
Home Financials for this Owner
Home Financials are based on the most recent Mortgage that was taken out on this home.
Original Mortgage
$276,000
Interest Rate
4.77%
Mortgage Type
Commercial
Purchase Details
Closed on
Jun 8, 2005
Sold by
Rocky Meadow Dev Corp
Bought by
Blais Bldrs Inc
Create a Home Valuation Report for This Property
The Home Valuation Report is an in-depth analysis detailing your home's value as well as a comparison with similar homes in the area
Home Values in the Area
Average Home Value in this Area
Purchase History
| Date | Buyer | Sale Price | Title Company |
|---|---|---|---|
| Viveiros Ana P | -- | None Available | |
| Ramirez Fausto | -- | -- | |
| Correia Francisco V | -- | -- | |
| Correia Francisco V | $345,000 | -- | |
| Blais Bldrs Inc | $180,000 | -- |
Source: Public Records
Mortgage History
| Date | Status | Borrower | Loan Amount |
|---|---|---|---|
| Previous Owner | Ramirez Fausto | $261,484 | |
| Previous Owner | Correia Francisco V | $276,000 |
Source: Public Records
Tax History Compared to Growth
Tax History
| Year | Tax Paid | Tax Assessment Tax Assessment Total Assessment is a certain percentage of the fair market value that is determined by local assessors to be the total taxable value of land and additions on the property. | Land | Improvement |
|---|---|---|---|---|
| 2025 | -- | $593,600 | $139,800 | $453,800 |
| 2024 | -- | $592,100 | $134,000 | $458,100 |
| 2023 | $0 | $478,100 | $134,000 | $344,100 |
| 2022 | $0 | $416,000 | $122,700 | $293,300 |
| 2021 | $0 | $357,000 | $99,700 | $257,300 |
| 2020 | $0 | $354,300 | $99,700 | $254,600 |
| 2019 | $5,531 | $354,300 | $99,700 | $254,600 |
| 2018 | $0 | $352,700 | $121,100 | $231,600 |
| 2017 | $0 | $328,100 | $117,100 | $211,000 |
| 2016 | -- | $313,500 | $109,100 | $204,400 |
| 2015 | -- | $303,000 | $109,100 | $193,900 |
Source: Public Records
Map
Nearby Homes
- 269 Purchase St
- 23 Shaw St
- 141 Rocky Meadow St
- Lot1 Elk Run Dr
- 4 Bella Path
- 236 Thomas St
- 9 Terrace Way
- 35 Silva St
- 26 Santana Way Unit 26
- 7 Green St
- 235 Main St
- 5 Carver Square Blvd Unit 5
- 5 Carver Square Blvd
- 11 Brockton Ave
- 759 Plymouth St
- 140 Tispaquin St
- 135 Plymouth St
- 81 Center St
- 47 Faye Ave
- 714 Plymouth St
- 318 Purchase St
- 322 Purchase St Unit Lot 9
- 320 Purchase St
- 324 Purchase St
- 315 Purchase St
- 8 Captain Hall Rd
- 6 Captain Hall Rd
- 282 Purchase St
- 282 Purchase St Unit 282
- 4 Captain Hall Rd
- Lot 0 Purchase St
- 328 Purchase St
- 8 Augustas Way
- 12 Augustas Way
- 16 Augustas Way
- 287 Purchase St
- Lot 23 Captain Hall Rd
- 6 Augustas Way
- 9 Captain Hall Rd
- Lot 11 Augustus Way