
Seller's Agent in 2019
Annick Smith
Coldwell Banker Walden & Kirkland
(229) 603-3546
76 Total Sales
Estimated Value: $387,999 - $456,000
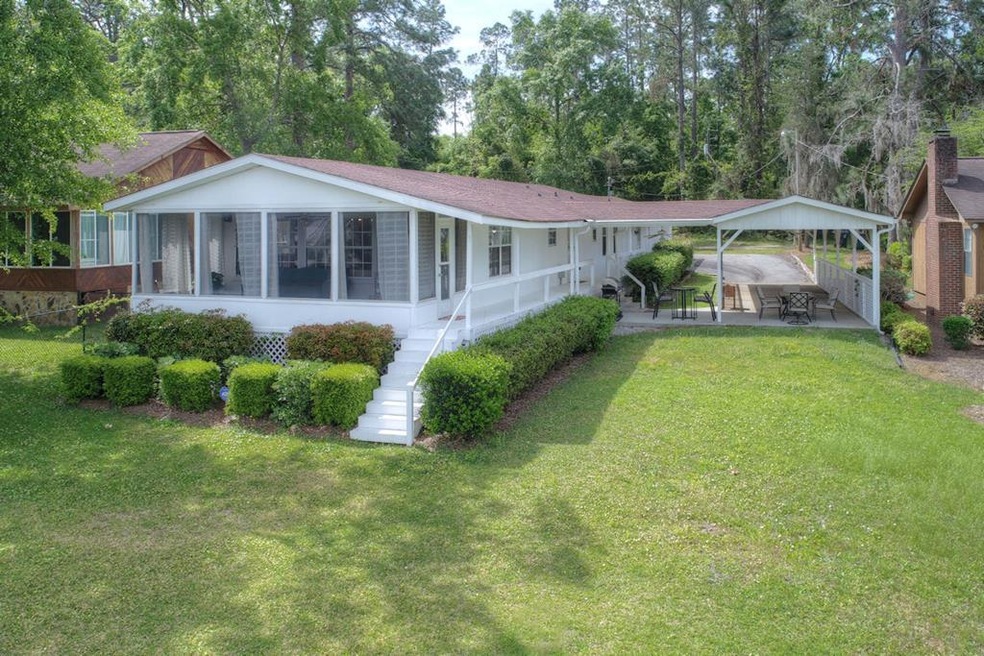
Fisherman's dream! Plenty of storage and outdoor living space make this lakefront home a perfect spot to spend your days on the water. This very well maintained home has three bedrooms, two full bathrooms, and one half-bath. The spacious kitchen has been updated and blends seamlessly into the living room and dining area. Off the living room is a great screened in porch overlooking the backyard and the lake. This property also has its very own concrete boat ramp in addition to a two-story boathouse with a screened in area and great top deck with awesome views! With water depth of almost 10' off the end of the dock, a fish cleaning station and a trap door to fish in the shade on those hot days, this property has so many amenities that make it a perfect lake getaway. To top it off, this lake property comes furnished and is move-in ready! Call for your showing today!
Last Agent to Sell the Property
Coldwell Banker Walden & Kirkland Brokerage Phone: 2294368811 License #379162 Listed on: 06/08/2019
Last Buyer's Agent
Non-Member Agent
Non Member Office
| Date | Buyer | Sale Price | Title Company |
|---|---|---|---|
| Lodge John Darrell | $240,000 | -- | |
| Perry Elmer Dallas | $262,000 | -- | |
| Noffsinger Thomas | $74,500 | -- | |
| Cowart Norman | -- | -- |
| Date | Status | Borrower | Loan Amount |
|---|---|---|---|
| Open | Lodge John Darrell | $140,000 | |
| Previous Owner | Perry Elmer Dallas | $235,800 |
| Date | Event | Price | List to Sale | Price per Sq Ft |
|---|---|---|---|---|
| 07/17/2019 07/17/19 | Sold | $240,000 | -- | $133 / Sq Ft |
| 06/08/2019 06/08/19 | Pending | -- | -- | -- |
| Year | Tax Paid | Tax Assessment Tax Assessment Total Assessment is a certain percentage of the fair market value that is determined by local assessors to be the total taxable value of land and additions on the property. | Land | Improvement |
|---|---|---|---|---|
| 2024 | $2,565 | $110,051 | $46,146 | $63,905 |
| 2023 | $2,245 | $95,393 | $46,146 | $49,247 |
| 2022 | $1,858 | $81,630 | $34,610 | $47,020 |
| 2021 | $2,213 | $74,639 | $34,610 | $40,029 |
| 2020 | $2,217 | $74,639 | $34,610 | $40,029 |
| 2019 | $2,203 | $74,639 | $34,610 | $40,029 |
| 2018 | $2,031 | $66,319 | $17,575 | $48,744 |
| 2017 | $2,039 | $66,319 | $17,575 | $48,744 |
| 2016 | $2,037 | $66,319 | $17,575 | $48,744 |
| 2015 | -- | $66,319 | $17,575 | $48,744 |
| 2014 | -- | $66,319 | $17,575 | $48,744 |
| 2013 | -- | $66,319 | $17,575 | $48,744 |
Seller's Agent in 2019
Annick Smith
Coldwell Banker Walden & Kirkland
(229) 603-3546
76 Total Sales
N
Buyer's Agent in 2019
Non-Member Agent
Non Member Office
Source: Albany Board of REALTORS®
MLS Number: 142806
APN: 007G-059