Estimated Value: $123,000 - $174,000
3
Beds
2
Baths
1,788
Sq Ft
$79/Sq Ft
Est. Value
About This Home
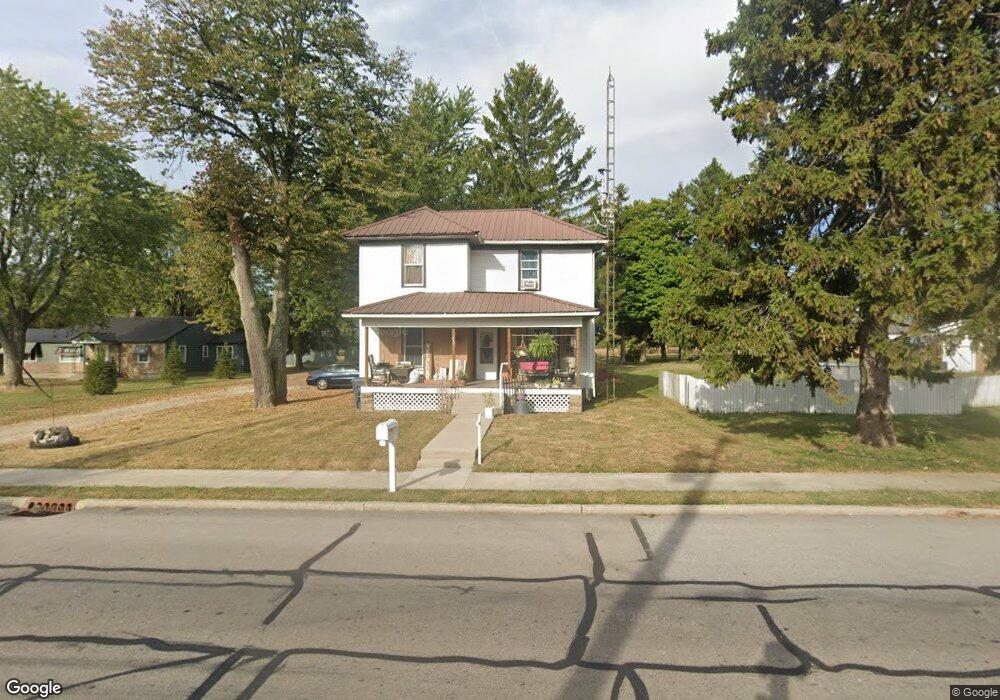
This home is located at 318 S Main St, Lynn, IN 47355 and is currently estimated at $142,108, approximately $79 per square foot. 318 S Main St is a home located in Randolph County with nearby schools including Randolph Southern Elementary School and Randolph Southern Junior/Senior High School.
Ownership History
Date
Name
Owned For
Owner Type
Purchase Details
Closed on
Sep 6, 2022
Sold by
Edwards Billy R and Edwards Marcia A
Bought by
Ray Marjorie
Current Estimated Value
Purchase Details
Closed on
Apr 1, 2009
Sold by
Mainsource Bank
Bought by
Edwards Billy R and Edwards Marica A
Purchase Details
Closed on
Oct 9, 2008
Sold by
Grubbs Mary C
Bought by
Main Source Bank
Create a Home Valuation Report for This Property
The Home Valuation Report is an in-depth analysis detailing your home's value as well as a comparison with similar homes in the area
Home Values in the Area
Average Home Value in this Area
Purchase History
| Date | Buyer | Sale Price | Title Company |
|---|---|---|---|
| Ray Marjorie | -- | None Listed On Document | |
| Edwards Billy R | -- | None Available | |
| Main Source Bank | $43,500 | None Available |
Source: Public Records
Tax History Compared to Growth
Tax History
| Year | Tax Paid | Tax Assessment Tax Assessment Total Assessment is a certain percentage of the fair market value that is determined by local assessors to be the total taxable value of land and additions on the property. | Land | Improvement |
|---|---|---|---|---|
| 2024 | $545 | $85,500 | $5,200 | $80,300 |
| 2023 | $511 | $85,500 | $5,200 | $80,300 |
| 2022 | $34 | $83,800 | $5,200 | $78,600 |
| 2021 | $34 | $90,900 | $7,300 | $83,600 |
| 2020 | $34 | $80,700 | $6,400 | $74,300 |
| 2019 | $34 | $78,400 | $6,400 | $72,000 |
| 2018 | $214 | $78,400 | $6,400 | $72,000 |
| 2017 | $199 | $71,800 | $6,400 | $65,400 |
| 2016 | $198 | $72,600 | $5,800 | $66,800 |
| 2014 | $155 | $67,200 | $5,500 | $61,700 |
| 2013 | $155 | $65,000 | $5,500 | $59,500 |
Source: Public Records
Map
Nearby Homes
- 410 N Main St
- 1820 E 700 S
- 5369 E 700 S
- 0 Round Barn Rd
- 2980 S 225 E
- 5818 S Arba Pike
- 0 Davis
- 107 N US Highway 27
- 701 W Cherry St
- 2336 W New Garden Rd
- 4668 S State Road 227
- 8459 N Pleasant St
- 0 Walnut St
- 8292 Main St
- 0 Greenville-Nashville Rd Unit 934533
- 1041 S Huntsville Rd
- 28 Stonebridge Dr
- 1033 S Huntsville Rd
- Lot 5 Huntsville Rd
- 170 Sunset Dr