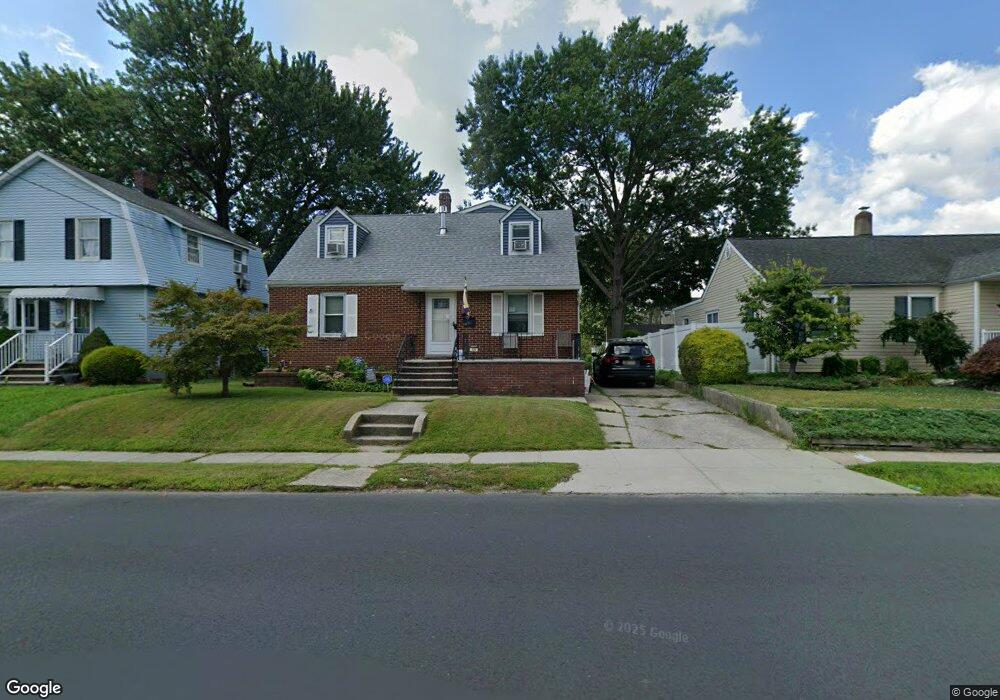
318 S Main St Milltown, NJ 08850
Estimated Value: $429,000 - $493,000
--
Bed
--
Bath
792
Sq Ft
$576/Sq Ft
Est. Value
About This Home
This home is located at 318 S Main St, Milltown, NJ 08850 and is currently estimated at $455,803, approximately $575 per square foot. 318 S Main St is a home located in Middlesex County with nearby schools including Parkview School, Joyce Kilmer Elementary School, and St. Bartholomew School.
Ownership History
Date
Name
Owned For
Owner Type
Purchase Details
Closed on
Jun 29, 2010
Sold by
Mason Glenn W and Mason Jillian E
Bought by
Quackenbush Thomas and Carver Ann
Current Estimated Value
Home Financials for this Owner
Home Financials are based on the most recent Mortgage that was taken out on this home.
Original Mortgage
$247,120
Outstanding Balance
$169,461
Interest Rate
5.37%
Mortgage Type
FHA
Estimated Equity
$286,342
Purchase Details
Closed on
Dec 7, 2004
Sold by
Keigher Kevin
Bought by
Mason Glenn W and Mason Jillian E
Home Financials for this Owner
Home Financials are based on the most recent Mortgage that was taken out on this home.
Original Mortgage
$100,000
Interest Rate
5.68%
Purchase Details
Closed on
Apr 13, 2000
Sold by
Scordo Maria
Bought by
Keigher Kevin
Home Financials for this Owner
Home Financials are based on the most recent Mortgage that was taken out on this home.
Original Mortgage
$137,700
Interest Rate
8.19%
Create a Home Valuation Report for This Property
The Home Valuation Report is an in-depth analysis detailing your home's value as well as a comparison with similar homes in the area
Home Values in the Area
Average Home Value in this Area
Purchase History
| Date | Buyer | Sale Price | Title Company |
|---|---|---|---|
| Quackenbush Thomas | $252,870 | Old Republic National Title | |
| Mason Glenn W | $260,000 | -- | |
| Keigher Kevin | $145,000 | -- |
Source: Public Records
Mortgage History
| Date | Status | Borrower | Loan Amount |
|---|---|---|---|
| Open | Quackenbush Thomas | $247,120 | |
| Previous Owner | Mason Glenn W | $100,000 | |
| Previous Owner | Keigher Kevin | $137,700 |
Source: Public Records
Tax History Compared to Growth
Tax History
| Year | Tax Paid | Tax Assessment Tax Assessment Total Assessment is a certain percentage of the fair market value that is determined by local assessors to be the total taxable value of land and additions on the property. | Land | Improvement |
|---|---|---|---|---|
| 2025 | $8,361 | $123,800 | $66,800 | $57,000 |
| 2024 | $8,209 | $123,800 | $66,800 | $57,000 |
| 2023 | $8,209 | $123,800 | $66,800 | $57,000 |
| 2022 | $8,172 | $123,800 | $66,800 | $57,000 |
| 2021 | $8,002 | $123,800 | $66,800 | $57,000 |
| 2020 | $7,809 | $123,800 | $66,800 | $57,000 |
| 2019 | $7,505 | $123,800 | $66,800 | $57,000 |
| 2018 | $7,060 | $123,800 | $66,800 | $57,000 |
| 2017 | $6,816 | $123,800 | $66,800 | $57,000 |
| 2016 | $6,574 | $123,800 | $66,800 | $57,000 |
| 2015 | $6,436 | $123,800 | $66,800 | $57,000 |
| 2014 | $6,210 | $123,800 | $66,800 | $57,000 |
Source: Public Records
Map
Nearby Homes