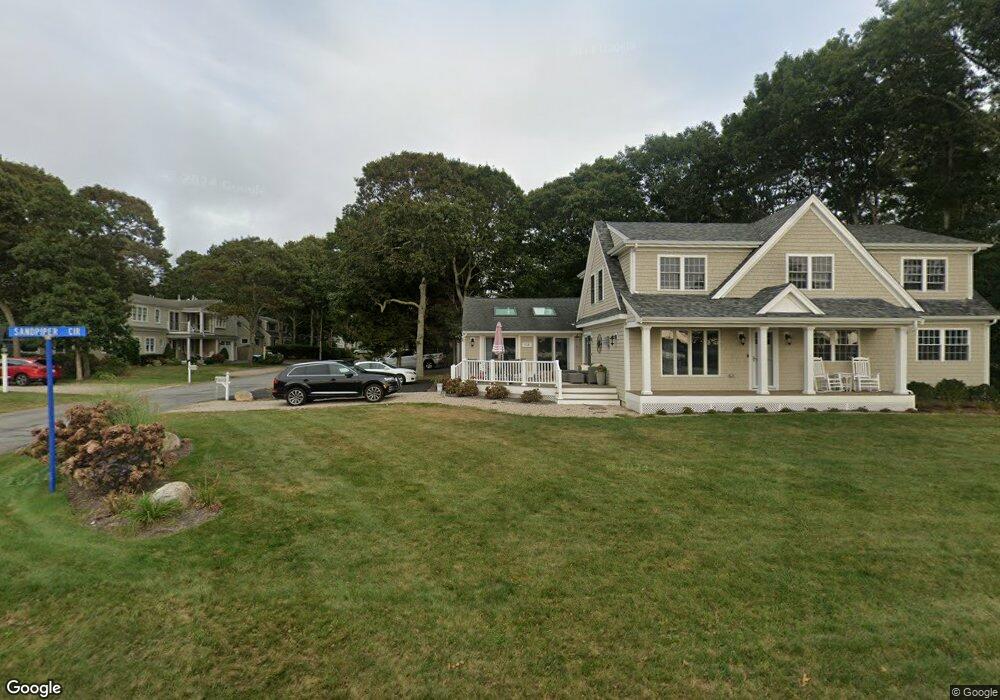
318 Shorewood Dr East Falmouth, MA 02536
Estimated Value: $968,000 - $1,380,860
3
Beds
2
Baths
1,801
Sq Ft
$647/Sq Ft
Est. Value
About This Home
This home is located at 318 Shorewood Dr, East Falmouth, MA 02536 and is currently estimated at $1,164,965, approximately $646 per square foot. 318 Shorewood Dr is a home located in Barnstable County with nearby schools including Teaticket Elementary School, Morse Pond School, and Lawrence School.
Ownership History
Date
Name
Owned For
Owner Type
Purchase Details
Closed on
Aug 25, 2014
Sold by
Ralph Michael and Ralph Michael D
Bought by
Ralph Ft and Ralph
Current Estimated Value
Purchase Details
Closed on
Feb 8, 2002
Sold by
Noonan Gail A
Bought by
Ralph Michael and Ralph Sally
Create a Home Valuation Report for This Property
The Home Valuation Report is an in-depth analysis detailing your home's value as well as a comparison with similar homes in the area
Home Values in the Area
Average Home Value in this Area
Purchase History
| Date | Buyer | Sale Price | Title Company |
|---|---|---|---|
| Ralph Ft | -- | -- | |
| Ralph Ft | -- | -- | |
| Ralph Michael | $399,000 | -- | |
| Ralph Michael | $399,000 | -- |
Source: Public Records
Mortgage History
| Date | Status | Borrower | Loan Amount |
|---|---|---|---|
| Previous Owner | Ralph Michael | $225,000 |
Source: Public Records
Tax History Compared to Growth
Tax History
| Year | Tax Paid | Tax Assessment Tax Assessment Total Assessment is a certain percentage of the fair market value that is determined by local assessors to be the total taxable value of land and additions on the property. | Land | Improvement |
|---|---|---|---|---|
| 2025 | $6,739 | $1,148,000 | $472,800 | $675,200 |
| 2024 | $6,558 | $1,044,300 | $429,800 | $614,500 |
| 2023 | $4,542 | $656,400 | $355,700 | $300,700 |
| 2022 | $4,622 | $574,200 | $312,700 | $261,500 |
| 2021 | $4,640 | $545,900 | $312,700 | $233,200 |
| 2020 | $4,444 | $517,400 | $284,200 | $233,200 |
| 2019 | $4,316 | $504,200 | $284,200 | $220,000 |
| 2018 | $4,216 | $490,200 | $284,200 | $206,000 |
| 2017 | $4,122 | $483,200 | $284,200 | $199,000 |
| 2016 | $4,041 | $482,800 | $284,200 | $198,600 |
| 2015 | $3,954 | $482,800 | $284,200 | $198,600 |
| 2014 | $3,923 | $481,300 | $284,100 | $197,200 |
Source: Public Records
Map
Nearby Homes
- 7 Sandpiper Cir
- 322 Shorewood Dr
- 75 Sandpiper Cir
- 2 Sandpiper Cir
- 10 Sandpointe
- 8 Sandpiper Cir
- 67 Sandpiper Cir
- 13 Sandpiper Cir
- 317 Shorewood Dr
- 330 Shorewood Dr
- 78 Sandpiper Cir
- 3 Sally Ln
- 313 Shorewood Dr
- 14 Sandpiper Cir
- 9 Sally Ln
- 72 Sandpiper Cir
- 65 Sandpiper Cir
- 17 Sandpiper Cir
- 307 Shorewood Dr
- 10 Joyce St