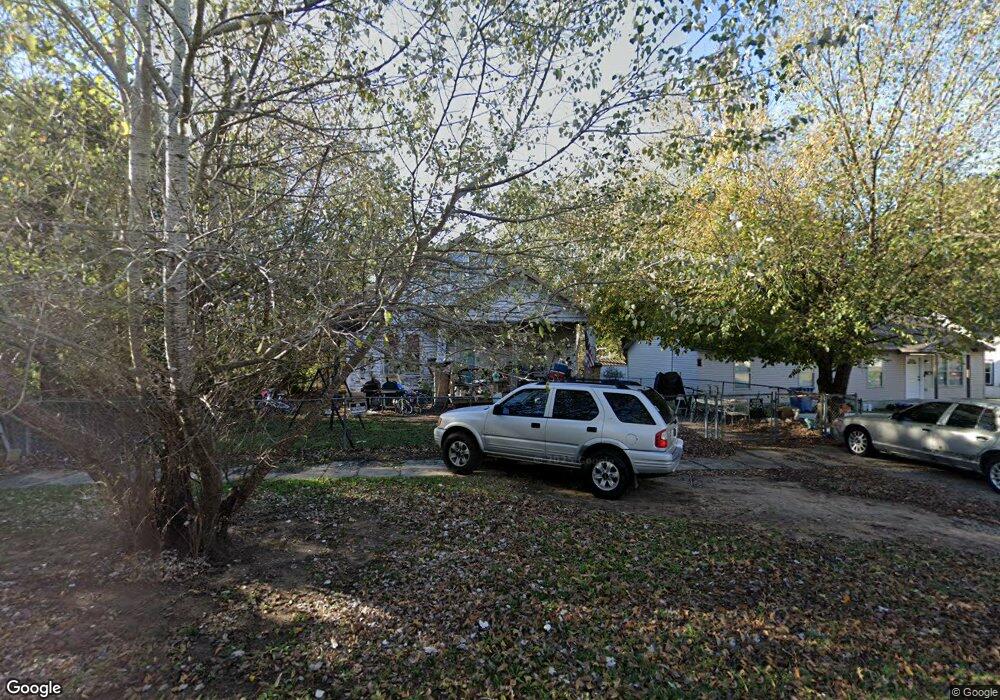
318 W Cherokee Ave McAlester, OK 74501
Estimated Value: $62,000 - $85,359
3
Beds
1
Bath
1,472
Sq Ft
$49/Sq Ft
Est. Value
About This Home
This home is located at 318 W Cherokee Ave, McAlester, OK 74501 and is currently estimated at $71,840, approximately $48 per square foot. 318 W Cherokee Ave is a home located in Pittsburg County with nearby schools including McAlester High School, Mcalester Christian Academy, and McAlester Christian Academy.
Ownership History
Date
Name
Owned For
Owner Type
Purchase Details
Closed on
Jun 3, 2014
Sold by
Gann Gregory John
Bought by
Gann Floyd J and Gann Phyllis
Current Estimated Value
Purchase Details
Closed on
Jun 12, 2013
Sold by
Gann Denise L
Bought by
Gann Gregory John
Purchase Details
Closed on
Oct 15, 2012
Sold by
Gann Gregory John
Bought by
Gann Denise L
Purchase Details
Closed on
Apr 1, 2006
Sold by
Rields Sarah R
Bought by
Gann Greg J and Gann Denise L
Home Financials for this Owner
Home Financials are based on the most recent Mortgage that was taken out on this home.
Original Mortgage
$13,600
Interest Rate
9%
Mortgage Type
FHA
Purchase Details
Closed on
May 20, 1998
Sold by
Graves
Bought by
Fields
Purchase Details
Closed on
Sep 12, 1994
Sold by
Benson Etal
Bought by
Graves
Create a Home Valuation Report for This Property
The Home Valuation Report is an in-depth analysis detailing your home's value as well as a comparison with similar homes in the area
Home Values in the Area
Average Home Value in this Area
Purchase History
| Date | Buyer | Sale Price | Title Company |
|---|---|---|---|
| Gann Floyd J | -- | -- | |
| Gann Gregory John | -- | None Available | |
| Gann Denise L | -- | None Available | |
| Gann Greg J | $9,000 | None Available | |
| Fields | $15,000 | -- | |
| Graves | $15,000 | -- |
Source: Public Records
Mortgage History
| Date | Status | Borrower | Loan Amount |
|---|---|---|---|
| Previous Owner | Gann Greg J | $13,600 |
Source: Public Records
Tax History Compared to Growth
Tax History
| Year | Tax Paid | Tax Assessment Tax Assessment Total Assessment is a certain percentage of the fair market value that is determined by local assessors to be the total taxable value of land and additions on the property. | Land | Improvement |
|---|---|---|---|---|
| 2025 | $254 | $2,890 | $420 | $2,470 |
| 2024 | $254 | $3,100 | $420 | $2,680 |
| 2023 | $272 | $3,091 | $340 | $2,751 |
| 2022 | $258 | $2,944 | $328 | $2,616 |
| 2021 | $256 | $2,944 | $328 | $2,616 |
| 2020 | $234 | $2,669 | $305 | $2,364 |
| 2019 | $205 | $2,670 | $311 | $2,359 |
| 2018 | $196 | $2,422 | $280 | $2,142 |
| 2017 | $188 | $2,306 | $266 | $2,040 |
| 2016 | $178 | $2,197 | $254 | $1,943 |
| 2015 | $156 | $2,092 | $234 | $1,858 |
| 2014 | $156 | $2,092 | $234 | $1,858 |
Source: Public Records
Map
Nearby Homes
- 604 W Cherokee Ave
- 422 W Cherokee Ave
- 401 W Cherokee Ave
- 0 W Delaware Ave
- 419 W Delaware Ave
- 509 W Cherokee Ave
- 0 Oklahoma 31 Unit 2543194
- 217 W Seminole Ave
- 220 W Washington
- 204 W Washington Ave
- 232 W Seminole Ave
- Pittsburg County
- 717 S A St
- 415 W Adams Ave
- 610 W Washington Ave
- 420 W Ottawa Ave
- 060 Oklahoma 31
- 102 Oklahoma 31
- 101 Oklahoma 31
- 1311 S George Nigh Expy
- 322 W Cherokee Ave
- 320 W Cherokee Ave
- 334 W Cherokee Ave
- 336 W Cherokee Ave
- 312 W Cherokee Ave
- 311 W Delaware Ave
- 319 W Cherokee Ave
- 317 W Cherokee Ave
- 212 S C St
- 305 W Cherokee Ave
- 212 McAlister Rt 4
- 327 W Cherokee Ave
- 214 S C St
- 307 W Delaware Ave
- 329 W Cherokee Ave
- 402 W Cherokee Ave
- 310 W Delaware Ave
- 303 W Cherokee Ave
- 301 W Cherokee Ave
- 318 W Delaware Ave