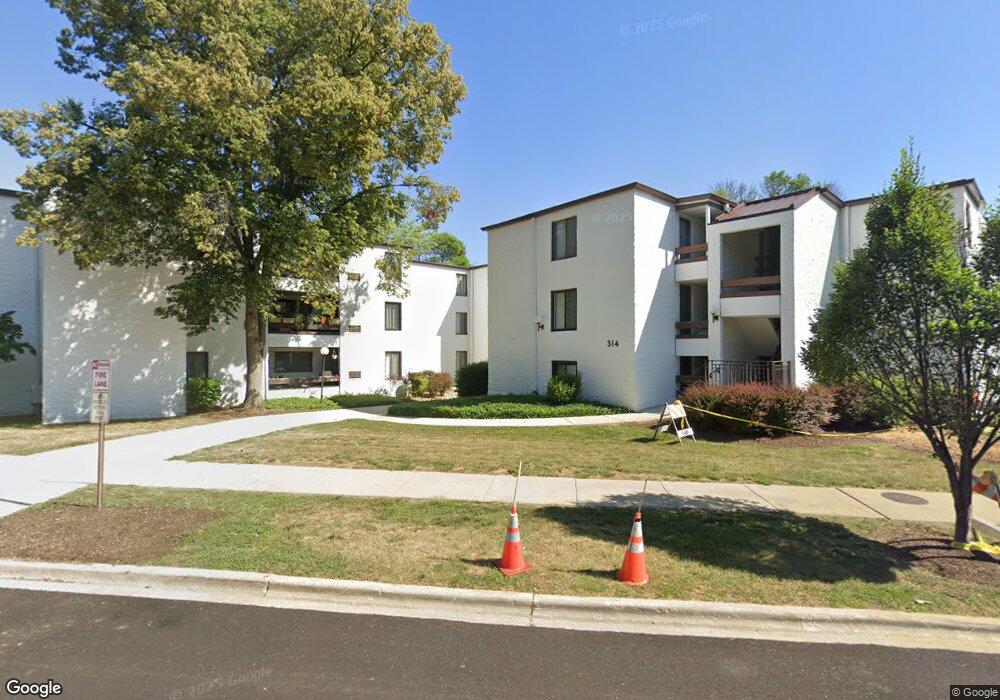
318 W Miner St Unit 318 Arlington Heights, IL 60005
Arlington Heights Central Business District NeighborhoodEstimated Value: $196,774 - $203,000
2
Beds
1
Bath
1,100
Sq Ft
$182/Sq Ft
Est. Value
About This Home
This home is located at 318 W Miner St Unit 318, Arlington Heights, IL 60005 and is currently estimated at $199,944, approximately $181 per square foot. 318 W Miner St Unit 318 is a home located in Cook County with nearby schools including Westgate Elementary School, South Middle School, and Rolling Meadows High School.
Ownership History
Date
Name
Owned For
Owner Type
Purchase Details
Closed on
Nov 5, 2004
Sold by
Lee Raymond S and Lee Hyung Hee
Bought by
Lee Raymond S
Current Estimated Value
Home Financials for this Owner
Home Financials are based on the most recent Mortgage that was taken out on this home.
Original Mortgage
$120,700
Outstanding Balance
$55,531
Interest Rate
4.62%
Mortgage Type
Unknown
Estimated Equity
$144,413
Purchase Details
Closed on
Nov 5, 2002
Sold by
Bergt Elizabeth
Bought by
Lee Raymond S and Lee Hyung Hee
Home Financials for this Owner
Home Financials are based on the most recent Mortgage that was taken out on this home.
Original Mortgage
$118,750
Interest Rate
5.12%
Purchase Details
Closed on
Mar 8, 1999
Sold by
Hudziak Lydia F
Bought by
Bergt Elizabeth
Home Financials for this Owner
Home Financials are based on the most recent Mortgage that was taken out on this home.
Original Mortgage
$81,700
Interest Rate
6.8%
Purchase Details
Closed on
Jun 19, 1997
Sold by
Hudziak Frank
Bought by
Hudziak Lydia P
Create a Home Valuation Report for This Property
The Home Valuation Report is an in-depth analysis detailing your home's value as well as a comparison with similar homes in the area
Home Values in the Area
Average Home Value in this Area
Purchase History
| Date | Buyer | Sale Price | Title Company |
|---|---|---|---|
| Lee Raymond S | -- | Multiple | |
| Lee Raymond S | $125,000 | -- | |
| Bergt Elizabeth | $86,000 | -- | |
| Hudziak Lydia P | -- | -- |
Source: Public Records
Mortgage History
| Date | Status | Borrower | Loan Amount |
|---|---|---|---|
| Open | Lee Raymond S | $120,700 | |
| Closed | Lee Raymond S | $118,750 | |
| Previous Owner | Bergt Elizabeth | $81,700 |
Source: Public Records
Tax History Compared to Growth
Tax History
| Year | Tax Paid | Tax Assessment Tax Assessment Total Assessment is a certain percentage of the fair market value that is determined by local assessors to be the total taxable value of land and additions on the property. | Land | Improvement |
|---|---|---|---|---|
| 2024 | $3,266 | $11,930 | $1,513 | $10,417 |
| 2023 | $3,145 | $11,930 | $1,513 | $10,417 |
| 2022 | $3,145 | $11,930 | $1,513 | $10,417 |
| 2021 | $3,307 | $10,986 | $189 | $10,797 |
| 2020 | $3,221 | $10,986 | $189 | $10,797 |
| 2019 | $3,206 | $12,209 | $189 | $12,020 |
| 2018 | $2,714 | $9,299 | $151 | $9,148 |
| 2017 | $2,682 | $9,299 | $151 | $9,148 |
| 2016 | $2,501 | $9,299 | $151 | $9,148 |
| 2015 | $1,444 | $7,513 | $718 | $6,795 |
| 2014 | $1,417 | $7,513 | $718 | $6,795 |
| 2013 | $1,365 | $7,513 | $718 | $6,795 |
Source: Public Records
Map
Nearby Homes
- 314 W Wing St
- 318 W Wing St
- 514 W Miner St Unit 2F
- 151 W Wing St Unit 301
- 201 N Vail Ave Unit 305
- 1 S Highland Ave Unit 800
- 1 S Highland Ave Unit 400
- 105 S Mitchell Ave
- 421 W Hawthorne St
- 105 S Vail Ave
- 121 S Vail Ave Unit 403
- 121 S Vail Ave Unit 401
- 77 S Evergreen Ave Unit 606
- 104 N Pine Ave Unit 505
- 24 S Kaspar Ave
- 32 N Belmont Ave
- 300 E Euclid Ave
- 1108 W Miner St
- 703 N Arlington Heights Rd
- 827 N Walnut Ave
- 318 W Miner St Unit 318
- 318 W Miner St Unit 318
- 318 W Miner St Unit 318
- 318 W Miner St Unit 318
- 318 W Miner St Unit 318
- 318 W Miner St Unit 2A
- 318 W Miner St Unit 3B
- 318 W Miner St Unit 1B
- 318 W Miner St Unit 2B
- 318 W Miner St Unit 1A
- 302 W Miner St Unit 302
- 302 W Miner St Unit 302
- 302 W Miner St Unit 302
- 302 W Miner St Unit 3A
- 302 W Miner St Unit 1A
- 322 W Miner St Unit 2C
- 322 W Miner St Unit 322
- 322 W Miner St Unit 322
- 322 W Miner St Unit 322
- 322 W Miner St Unit 322