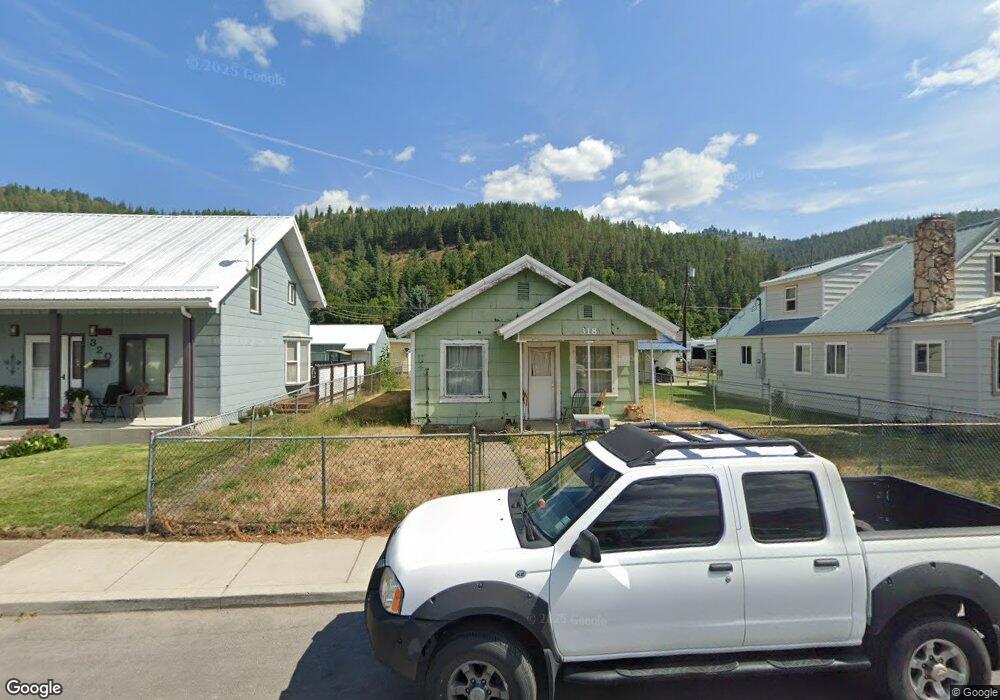
318 W Mullan Ave Kellogg, ID 83837
Estimated Value: $183,000 - $252,000
2
Beds
1
Bath
842
Sq Ft
$260/Sq Ft
Est. Value
About This Home
This home is located at 318 W Mullan Ave, Kellogg, ID 83837 and is currently estimated at $218,862, approximately $259 per square foot. 318 W Mullan Ave is a home located in Shoshone County with nearby schools including Pinehurst Elementary School, Kellogg Middle School, and Kellogg High School.
Ownership History
Date
Name
Owned For
Owner Type
Purchase Details
Closed on
Dec 17, 2019
Sold by
Whitewater Cilffs Llc
Bought by
Webb Alicia
Current Estimated Value
Home Financials for this Owner
Home Financials are based on the most recent Mortgage that was taken out on this home.
Original Mortgage
$59,946
Interest Rate
3.72%
Mortgage Type
New Conventional
Purchase Details
Closed on
Jul 15, 2019
Sold by
Boatman Aaron
Bought by
Whitewater Cliffs Llc
Purchase Details
Closed on
May 13, 2019
Sold by
Kennedy Tommy D
Bought by
Boatman Aaron
Purchase Details
Closed on
May 10, 2019
Sold by
Kennedy Lequetta
Bought by
Kennedy Thomas D
Purchase Details
Closed on
May 26, 2005
Sold by
Whalen Family Lp
Bought by
Kennedy Tommy D
Home Financials for this Owner
Home Financials are based on the most recent Mortgage that was taken out on this home.
Original Mortgage
$50,000
Interest Rate
5.84%
Mortgage Type
Unknown
Create a Home Valuation Report for This Property
The Home Valuation Report is an in-depth analysis detailing your home's value as well as a comparison with similar homes in the area
Home Values in the Area
Average Home Value in this Area
Purchase History
| Date | Buyer | Sale Price | Title Company |
|---|---|---|---|
| Webb Alicia | -- | First American Ttl Co Kello | |
| Whitewater Cliffs Llc | -- | None Available | |
| Boatman Aaron | -- | First American Ttl Co Kello | |
| Kennedy Thomas D | -- | First American Ttl Co Kello | |
| Kennedy Tommy D | -- | -- |
Source: Public Records
Mortgage History
| Date | Status | Borrower | Loan Amount |
|---|---|---|---|
| Previous Owner | Webb Alicia | $59,946 | |
| Previous Owner | Kennedy Tommy D | $50,000 |
Source: Public Records
Tax History Compared to Growth
Tax History
| Year | Tax Paid | Tax Assessment Tax Assessment Total Assessment is a certain percentage of the fair market value that is determined by local assessors to be the total taxable value of land and additions on the property. | Land | Improvement |
|---|---|---|---|---|
| 2025 | $788 | $157,998 | $76,775 | $81,223 |
| 2024 | $788 | $157,998 | $76,775 | $81,223 |
| 2023 | $788 | $139,105 | $70,347 | $68,758 |
| 2022 | $860 | $122,501 | $65,108 | $57,393 |
| 2021 | $770 | $77,042 | $24,867 | $52,175 |
| 2020 | $667 | $63,960 | $23,167 | $40,793 |
| 2019 | $1,272 | $59,669 | $18,811 | $40,858 |
| 2018 | $1,172 | $47,123 | $17,101 | $30,022 |
| 2017 | $1,092 | $44,530 | $17,101 | $27,429 |
| 2016 | $1,089 | $43,051 | $17,101 | $25,950 |
| 2015 | -- | $43,051 | $17,101 | $25,950 |
| 2014 | -- | $43,051 | $17,101 | $25,950 |
Source: Public Records
Map
Nearby Homes
- 404 Mullan Ave W
- 411 W Mullan Ave
- 316 W Mission Ave
- 414 W Mission Ave
- 316 W Brown Ave
- 138 W Riverside Ave
- NKA Riverside Ave W
- 130 W Mullan Ave
- 516 W Mullan Ave
- 516 W Mission Ave
- 512 W Cameron Ave
- 520 W Mission Ave
- 0 Vergobbi Unit 25-4752
- 607 W Riverside Ave
- 110 Morning Star Dr Unit 159
- 110 Morning Star Dr Unit 332
- 150 Morning Star Dr Unit 371
- 150 Morning Star Dr Unit 379
- 150 Morning Star Dr Unit 381
- 150 Morning Star Dr Unit 292
- 316 W Mullan Ave
- 320 W Mullan Ave
- 314 W Mullan Ave
- 315 W Mission Ave
- 312 Mullan Ave W
- 402 W Mullan Ave
- 317 W Mullan Ave
- 319 W Mission Ave
- 310 W Mullan Ave
- 319 W Mullan Ave
- 315 W Mullan Ave
- 313 W Mission Ave
- 313 W Mullan Ave
- 311 Mullan Ave W
- 401 W Mission Ave
- 308 W Mullan Ave
- 311 W Mission Ave
- 420 N Chestnut St
- 406 W Mullan Ave
- 403 W Mission Ave