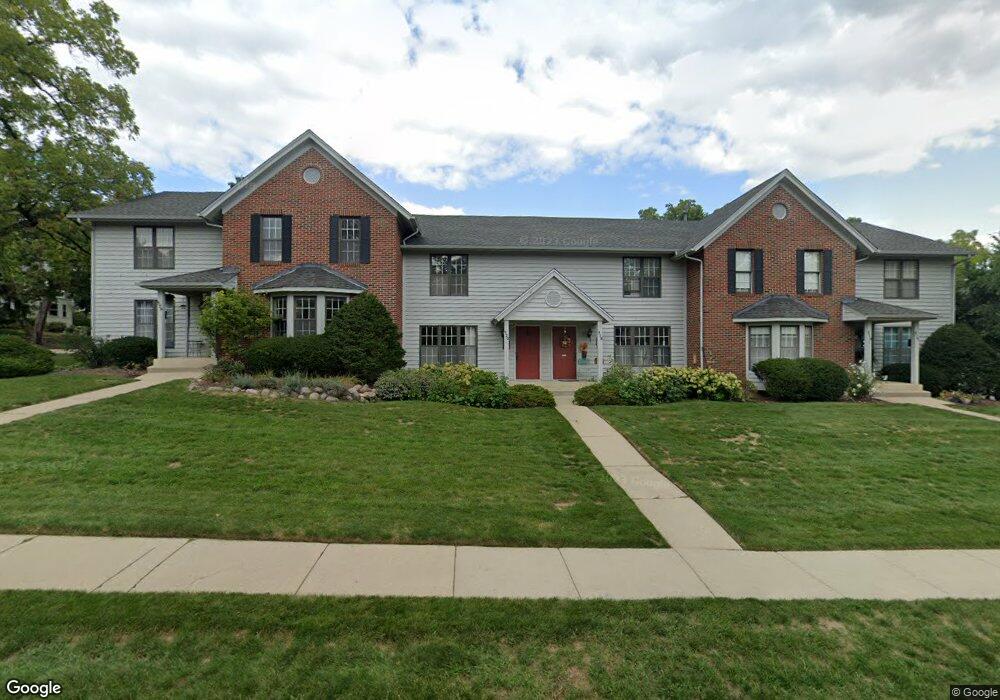
318 W South St Unit 4A Woodstock, IL 60098
Estimated Value: $199,000 - $229,000
2
Beds
2
Baths
1,188
Sq Ft
$179/Sq Ft
Est. Value
About This Home
This home is located at 318 W South St Unit 4A, Woodstock, IL 60098 and is currently estimated at $212,922, approximately $179 per square foot. 318 W South St Unit 4A is a home located in McHenry County with nearby schools including Olson Elementary School, Creekside Middle School, and Woodstock High School.
Ownership History
Date
Name
Owned For
Owner Type
Purchase Details
Closed on
Nov 3, 2003
Sold by
Hausner Helga G
Bought by
Hausner Helga G and Helga G Hausner Living Trust
Current Estimated Value
Purchase Details
Closed on
May 14, 2003
Sold by
Obrien Kevin M
Bought by
Hausner Helga G
Purchase Details
Closed on
Feb 6, 2002
Sold by
Obrien Kenneth J
Bought by
Obrien Kenneth J and Kenneth J Obrien Self Declaration Trust
Purchase Details
Closed on
Dec 5, 2001
Sold by
Obrien Kenneth J
Bought by
Obrien Kenneth J
Purchase Details
Closed on
Dec 29, 1997
Sold by
Obrien Kenneth J
Bought by
Obrien Kenneth J and Kenneth J Obrien Self Declaration Trust
Purchase Details
Closed on
Apr 24, 1996
Sold by
Krebs Patsy Forsythe
Bought by
Obrien Kenneth J
Home Financials for this Owner
Home Financials are based on the most recent Mortgage that was taken out on this home.
Original Mortgage
$65,000
Interest Rate
7.91%
Create a Home Valuation Report for This Property
The Home Valuation Report is an in-depth analysis detailing your home's value as well as a comparison with similar homes in the area
Home Values in the Area
Average Home Value in this Area
Purchase History
| Date | Buyer | Sale Price | Title Company |
|---|---|---|---|
| Hausner Helga G | -- | -- | |
| Hausner Helga G | $129,000 | Fatic | |
| Obrien Kenneth J | -- | -- | |
| Obrien Kenneth J | -- | Stewart Title Company | |
| Obrien Kenneth J | -- | -- | |
| Obrien Kenneth J | $97,000 | -- |
Source: Public Records
Mortgage History
| Date | Status | Borrower | Loan Amount |
|---|---|---|---|
| Previous Owner | Obrien Kenneth J | $65,000 |
Source: Public Records
Tax History Compared to Growth
Tax History
| Year | Tax Paid | Tax Assessment Tax Assessment Total Assessment is a certain percentage of the fair market value that is determined by local assessors to be the total taxable value of land and additions on the property. | Land | Improvement |
|---|---|---|---|---|
| 2024 | $1,053 | $54,151 | $2,657 | $51,494 |
| 2023 | $3,225 | $48,970 | $2,403 | $46,567 |
| 2022 | $1,693 | $43,460 | $2,133 | $41,327 |
| 2021 | $1,733 | $40,606 | $1,993 | $38,613 |
| 2020 | $1,765 | $38,584 | $1,894 | $36,690 |
| 2019 | $1,802 | $36,831 | $1,808 | $35,023 |
| 2018 | $1,831 | $32,625 | $2,062 | $30,563 |
| 2017 | $1,921 | $30,706 | $1,941 | $28,765 |
| 2016 | $2,073 | $28,431 | $1,797 | $26,634 |
| 2013 | -- | $33,081 | $1,099 | $31,982 |
Source: Public Records
Map
Nearby Homes
- 3902 Riverwoods Dr
- 1249 Prairie Ridge Trail
- 4022 Meadowridge Rd
- 3857 Riverwoods Dr
- 3917 Riverwoods Dr
- 3905 Riverwoods Dr
- 3839 Riverwoods Dr
- 3845 Riverwoods Dr
- 1288 Prairie Ridge Trail
- 1253 Prairie Ridge Trail
- 1245 Prairie Ridge Trail
- Brighton Plan at Clublands of Antioch - Horizon Series
- Meadowlark Plan at Clublands of Antioch - Horizon Series
- Siena Plan at Clublands of Antioch - Andare Series
- Napa Plan at Clublands of Antioch - Andare Series
- Starling Plan at Clublands of Antioch - Horizon Series
- Rutherford Plan at Clublands of Antioch - Andare Series
- Townsend Plan at Clublands of Antioch - Horizon Series
- Wren Plan at Clublands of Antioch - Horizon Series
- Sonoma Plan at Clublands of Antioch - Andare Series
- 324 W South St Unit A1
- 314 W South St Unit A6
- 320 W South St Unit A3
- 316 W South St Unit A5
- 320 W South St Unit 3
- 319 W Calhoun St
- 203 S Hayward St
- 222 S Tryon St Unit 8
- 222 S Tryon St
- 222 S Tryon St Unit 6
- 315 W Calhoun St
- 323 W South St
- 220 S Hayward St
- 319 W South St
- 212 S Tryon St
- 313 W South St
- 210 S Hayward St
- 304 S Tryon St
- 200 S Tryon St
- 315 S Hayward St