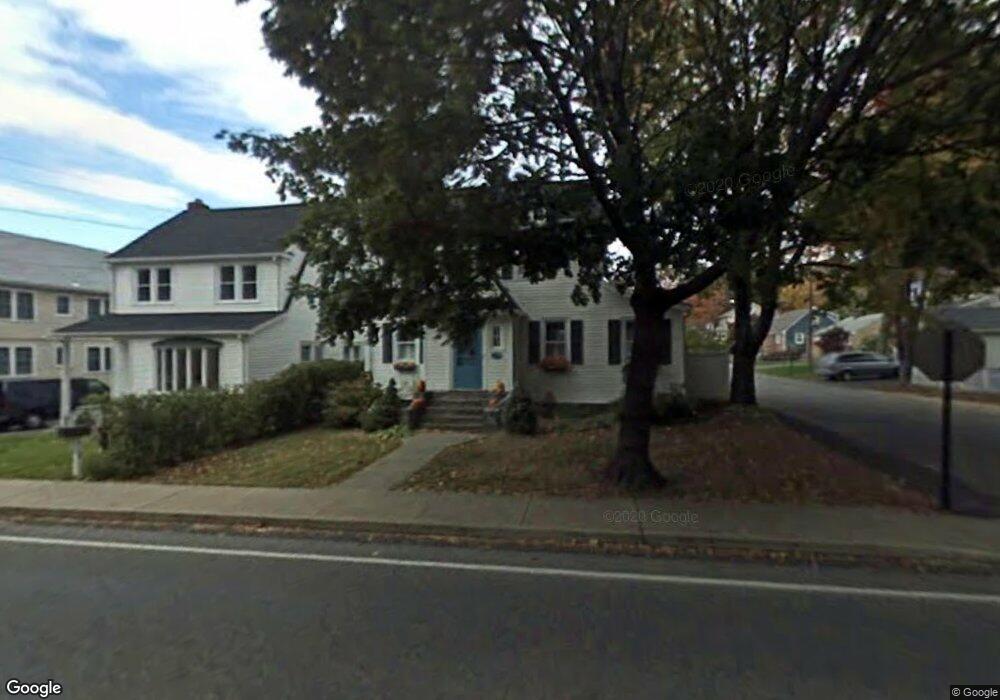
318 West Ave Darien, CT 06820
Estimated Value: $907,000 - $1,325,000
3
Beds
2
Baths
1,572
Sq Ft
$734/Sq Ft
Est. Value
About This Home
This home is located at 318 West Ave, Darien, CT 06820 and is currently estimated at $1,154,275, approximately $734 per square foot. 318 West Ave is a home located in Fairfield County with nearby schools including Holmes Elementary School, Middlesex Middle School, and Darien High School.
Ownership History
Date
Name
Owned For
Owner Type
Purchase Details
Closed on
May 17, 2010
Sold by
Bejger Roman A and Bejger Motryja
Bought by
Horner Caroline D
Current Estimated Value
Home Financials for this Owner
Home Financials are based on the most recent Mortgage that was taken out on this home.
Original Mortgage
$564,000
Interest Rate
5.11%
Purchase Details
Closed on
Jul 29, 2005
Sold by
Garrick Jameson Dryden and Garrick Helene Jennifer
Bought by
Bejger Roman A and Bejger Motryja
Purchase Details
Closed on
Jun 16, 2000
Sold by
West Philip W and West Elizabeth A
Bought by
Garrick Jameson D and Garrick Helene J
Purchase Details
Closed on
Jan 15, 1997
Sold by
Mcauliffe Kevin and Mcauliffe Keleigh
Bought by
West Philip W and West Elizabeth A
Purchase Details
Closed on
Oct 25, 1993
Sold by
Greenwood Janit
Bought by
Mcauliffe Kevin and Mcauliffe Keleigh
Create a Home Valuation Report for This Property
The Home Valuation Report is an in-depth analysis detailing your home's value as well as a comparison with similar homes in the area
Home Values in the Area
Average Home Value in this Area
Purchase History
| Date | Buyer | Sale Price | Title Company |
|---|---|---|---|
| Horner Caroline D | $70,500 | -- | |
| Bejger Roman A | $614,500 | -- | |
| Garrick Jameson D | $410,000 | -- | |
| West Philip W | $290,000 | -- | |
| Mcauliffe Kevin | $250,000 | -- |
Source: Public Records
Mortgage History
| Date | Status | Borrower | Loan Amount |
|---|---|---|---|
| Open | Mcauliffe Kevin | $516,900 | |
| Closed | Mcauliffe Kevin | $564,000 |
Source: Public Records
Tax History
| Year | Tax Paid | Tax Assessment Tax Assessment Total Assessment is a certain percentage of the fair market value that is determined by local assessors to be the total taxable value of land and additions on the property. | Land | Improvement |
|---|---|---|---|---|
| 2025 | $8,741 | $564,690 | $377,160 | $187,530 |
| 2024 | $8,295 | $564,690 | $377,160 | $187,530 |
| 2023 | $8,601 | $488,390 | $359,170 | $129,220 |
| 2022 | $8,415 | $488,390 | $359,170 | $129,220 |
| 2021 | $8,224 | $488,390 | $359,170 | $129,220 |
| 2020 | $7,990 | $488,390 | $359,170 | $129,220 |
| 2019 | $8,044 | $488,390 | $359,170 | $129,220 |
| 2018 | $7,284 | $452,970 | $279,160 | $173,810 |
| 2017 | $7,320 | $452,970 | $279,160 | $173,810 |
| 2016 | $7,143 | $452,970 | $279,160 | $173,810 |
| 2015 | $6,953 | $452,970 | $279,160 | $173,810 |
| 2014 | $6,799 | $452,970 | $279,160 | $173,810 |
Source: Public Records
Map
Nearby Homes
- 15 Charles St
- 11 Patton Dr
- 167 Hollow Tree Ridge Rd
- 166 Hollow Tree Ridge Rd
- 77 Maple St
- 12 Walmsley Rd
- 29 Walmsley Rd
- 66 Stanton Rd
- 25 Devon Rd
- 22 Radio Place Unit 10
- 32 Relihan Rd
- 3 Hickory Ln
- 3 Abbey Rd
- 88 Maple Tree Ave Unit G
- 17 Sunnyside Ave
- 25 Hillside Ave
- 3 Revere Rd
- 16 Fairfield Ave
- 19 Thomasina Ln
- 24 King St
Your Personal Tour Guide
Ask me questions while you tour the home.