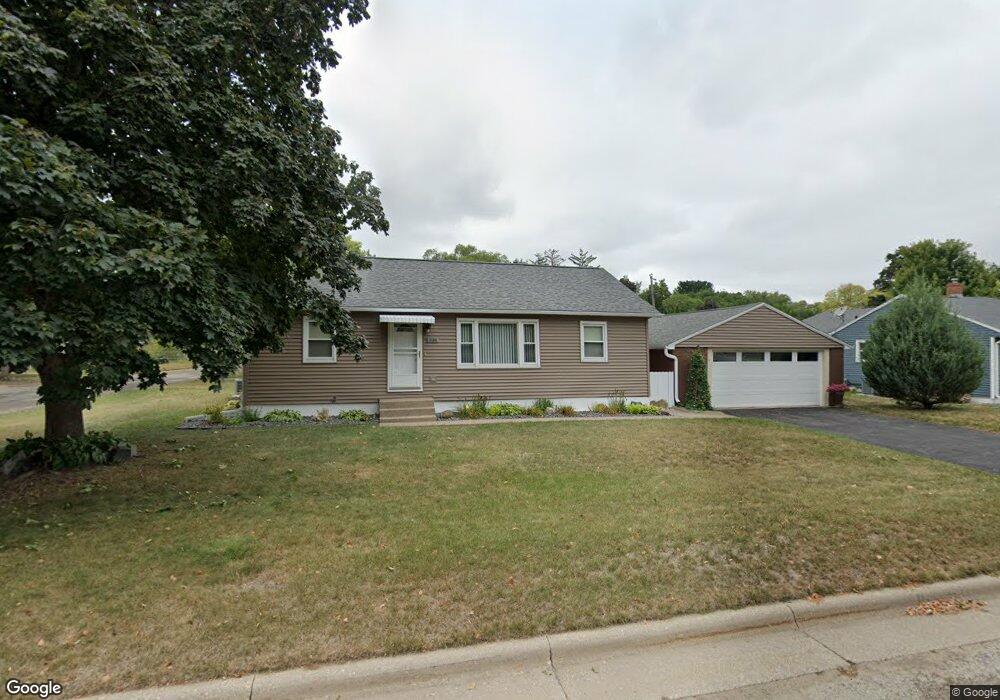
3180 26th St S La Crosse, WI 54601
Hintgen NeighborhoodEstimated Value: $226,000 - $286,000
3
Beds
1
Bath
1,040
Sq Ft
$240/Sq Ft
Est. Value
About This Home
This home is located at 3180 26th St S, La Crosse, WI 54601 and is currently estimated at $249,321, approximately $239 per square foot. 3180 26th St S is a home located in La Crosse County with nearby schools including Hintgen Elementary School, Longfellow Middle School, and Central High School.
Ownership History
Date
Name
Owned For
Owner Type
Purchase Details
Closed on
Feb 11, 2021
Sold by
Buehler Carolyn S and Buehler Fred
Bought by
Lydon Jean M
Current Estimated Value
Home Financials for this Owner
Home Financials are based on the most recent Mortgage that was taken out on this home.
Original Mortgage
$150,000
Outstanding Balance
$134,159
Interest Rate
2.7%
Mortgage Type
New Conventional
Estimated Equity
$115,162
Purchase Details
Closed on
May 26, 2015
Sold by
Larson Carolyn S
Bought by
Burg Jennifer Lynn and Larson Brian Michael
Purchase Details
Closed on
Apr 22, 2008
Sold by
Storey Shirley A and Beranek Stanley F
Bought by
Larson Carolyn S
Home Financials for this Owner
Home Financials are based on the most recent Mortgage that was taken out on this home.
Original Mortgage
$84,300
Interest Rate
6.17%
Mortgage Type
New Conventional
Create a Home Valuation Report for This Property
The Home Valuation Report is an in-depth analysis detailing your home's value as well as a comparison with similar homes in the area
Home Values in the Area
Average Home Value in this Area
Purchase History
| Date | Buyer | Sale Price | Title Company |
|---|---|---|---|
| Lydon Jean M | $170,000 | New Castle Title | |
| Burg Jennifer Lynn | -- | -- | |
| Larson Carolyn S | $87,000 | None Available |
Source: Public Records
Mortgage History
| Date | Status | Borrower | Loan Amount |
|---|---|---|---|
| Open | Lydon Jean M | $150,000 | |
| Previous Owner | Larson Carolyn S | $84,300 |
Source: Public Records
Tax History Compared to Growth
Tax History
| Year | Tax Paid | Tax Assessment Tax Assessment Total Assessment is a certain percentage of the fair market value that is determined by local assessors to be the total taxable value of land and additions on the property. | Land | Improvement |
|---|---|---|---|---|
| 2023 | $2,912 | $157,400 | $24,300 | $133,100 |
| 2022 | $2,802 | $157,400 | $24,300 | $133,100 |
| 2021 | $2,550 | $110,900 | $24,300 | $86,600 |
| 2020 | $2,595 | $110,900 | $24,300 | $86,600 |
| 2019 | $2,549 | $110,900 | $24,300 | $86,600 |
| 2018 | $2,213 | $85,100 | $20,000 | $65,100 |
| 2017 | $2,263 | $85,100 | $20,000 | $65,100 |
| 2016 | $2,476 | $85,100 | $20,000 | $65,100 |
| 2015 | $2,269 | $85,100 | $20,000 | $65,100 |
| 2014 | $2,254 | $85,100 | $20,000 | $65,100 |
| 2013 | $2,322 | $85,100 | $20,000 | $65,100 |
Source: Public Records
Map
Nearby Homes
- 3170 27th St S
- 3314 27th St S
- 2815 Robinsdale Ave
- 3010 27th St S
- 3540 East Ave S Unit B
- 3439 East Ave S
- 3166 33rd St S
- 3026 33rd St S
- 4430 Mormon Coulee Rd
- 3464 Woodbridge Ct Unit 10
- 2600 Ward Ave
- 2720 Ward Ave
- 3316 Bayside Ct
- 3214 Cliffside Dr
- 4127 Kammel Rd
- 3100 Lincoln Ave
- 4625 Mormon Coulee Rd
- 2612 30th St S
- 2415 Losey Blvd S
- 3013 Lakota Place
- 2511 Highland St
- 3172 26th St S
- 3181 26th St S
- 3202 26th St S
- 3183 25th St S
- 3166 26th St S
- 3175 25th St S
- 3169 25th St S
- 3173 26th St S
- 2611 Highland St
- 3160 26th St S
- 2602 Highland St
- 2500 Highland St
- 3167 26th St S
- 3161 25th St S
- 2523 Robinsdale Ave
- 2517 Robinsdale Ave
- 3209 26th St S
- 3154 26th St S
- 3165 26th St S