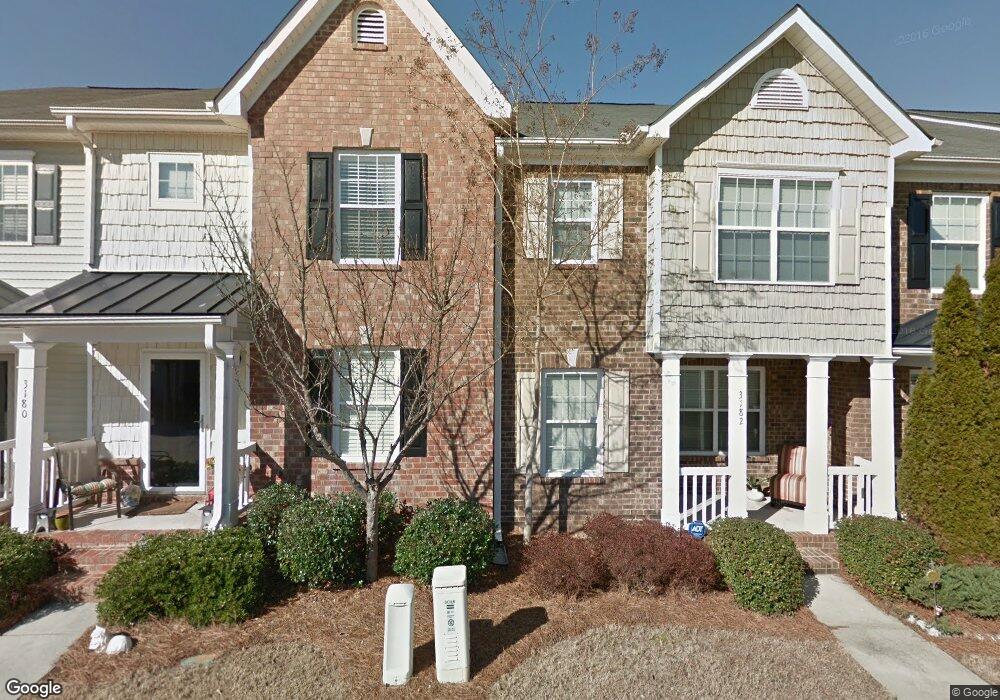
3180 Parc Ct SW Atlanta, GA 30311
Southwest Atlanta NeighborhoodEstimated Value: $226,631 - $253,000
3
Beds
3
Baths
1,678
Sq Ft
$145/Sq Ft
Est. Value
About This Home
This home is located at 3180 Parc Ct SW, Atlanta, GA 30311 and is currently estimated at $243,908, approximately $145 per square foot. 3180 Parc Ct SW is a home located in Fulton County with nearby schools including Kimberly Elementary School, Bunche Middle School, and Therrell High School.
Ownership History
Date
Name
Owned For
Owner Type
Purchase Details
Closed on
Nov 2, 2021
Sold by
Givens Micheal Jerome
Bought by
Givens Micheal Jerome and Givens Sandra Denise
Current Estimated Value
Purchase Details
Closed on
Nov 18, 2015
Sold by
Colbert Carlisha S
Bought by
Gentles Carlisha Colbert
Home Financials for this Owner
Home Financials are based on the most recent Mortgage that was taken out on this home.
Original Mortgage
$124,012
Interest Rate
4.37%
Mortgage Type
FHA
Purchase Details
Closed on
Oct 20, 2008
Sold by
Villages Of Kings Ridge/Cascad
Bought by
Colbert Carlisha S
Home Financials for this Owner
Home Financials are based on the most recent Mortgage that was taken out on this home.
Original Mortgage
$141,581
Interest Rate
5.78%
Mortgage Type
FHA
Create a Home Valuation Report for This Property
The Home Valuation Report is an in-depth analysis detailing your home's value as well as a comparison with similar homes in the area
Home Values in the Area
Average Home Value in this Area
Purchase History
| Date | Buyer | Sale Price | Title Company |
|---|---|---|---|
| Givens Micheal Jerome | -- | -- | |
| Givens Michael Jerome | $192,000 | -- | |
| Gentles Carlisha Colbert | -- | -- | |
| Colbert Carlisha S | $142,000 | -- |
Source: Public Records
Mortgage History
| Date | Status | Borrower | Loan Amount |
|---|---|---|---|
| Previous Owner | Gentles Carlisha Colbert | $124,012 | |
| Previous Owner | Colbert Carlisha S | $141,581 |
Source: Public Records
Tax History Compared to Growth
Tax History
| Year | Tax Paid | Tax Assessment Tax Assessment Total Assessment is a certain percentage of the fair market value that is determined by local assessors to be the total taxable value of land and additions on the property. | Land | Improvement |
|---|---|---|---|---|
| 2025 | $1,011 | $99,760 | $13,880 | $85,880 |
| 2023 | $3,897 | $94,120 | $13,080 | $81,040 |
| 2022 | $2,993 | $73,960 | $11,400 | $62,560 |
| 2021 | $2,538 | $62,640 | $9,880 | $52,760 |
| 2020 | $1,945 | $47,480 | $13,520 | $33,960 |
| 2019 | $150 | $46,640 | $13,280 | $33,360 |
| 2018 | $1,373 | $33,160 | $8,440 | $24,720 |
| 2017 | $985 | $22,800 | $3,360 | $19,440 |
| 2016 | $987 | $22,800 | $3,360 | $19,440 |
| 2015 | $94 | $22,800 | $3,360 | $19,440 |
| 2014 | $38 | $22,800 | $3,360 | $19,440 |
Source: Public Records
Map
Nearby Homes
- 3262 Cascade Parc Blvd SW
- 3277 Cascade Parc Blvd SW
- 3142 Imperial Cir SW
- 3457 Parc Dr SW
- 3140 Tylerton Dr SW
- 3320 Tiara Cir SW
- 3170 Esplandade
- 3361 Glenview Cir SW
- 3390 Glenview Cir SW
- 2031 Briar Trail Ct SW
- 3467 Valley Ridge Terrace SW
- 2261 Star Mist Dr SW
- 3132 Lovell Dr SW
- 2329 Meadowlane Dr SW
- 3568 Glenview Cir SW
- 3598 Ingledale Dr SW
- 2000 Fairburn Rd SW
- 0 Landrum Dr SW Unit 10521931
- 2265 Childress Dr SW
- 2263 Barge Rd SW
- 3180 Parc Ct SW Unit B-84
- 3182 Parc Ct SW
- 3178 Parc Ct SW
- 3178 Parc Ct SW Unit B83
- 3184 Parc Ct SW
- 3186 Parc Ct SW
- 3176 Parc Ct SW
- 3176 Parc Ct SW Unit 3176
- 3188 Parc Ct SW
- 3174 Parc Ct SW
- 3272 Cascade Parc Blvd SW Unit 3272
- 3272 Cascade Parc Blvd SW Unit 3274
- 3272 Cascade Parc Blvd SW
- 3190 Parc Ct SW
- 3172 Parc Ct SW
- 3170 Parc Ct SW
- 3170 Parc Ct SW Unit B79
- 3274 Cascade Parc Blvd SW
- 3274 Cascade Parc Blvd SW Unit 3274