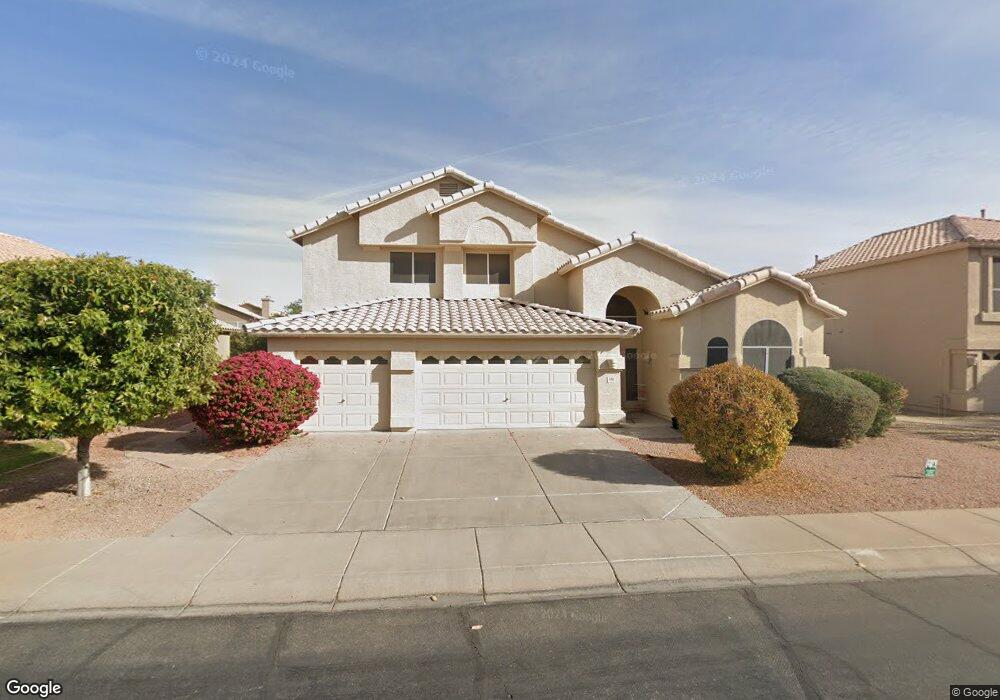
3180 W Stephens Place Chandler, AZ 85226
West Chandler NeighborhoodEstimated Value: $638,921 - $756,000
--
Bed
3
Baths
2,973
Sq Ft
$242/Sq Ft
Est. Value
About This Home
This home is located at 3180 W Stephens Place, Chandler, AZ 85226 and is currently estimated at $719,480, approximately $242 per square foot. 3180 W Stephens Place is a home located in Maricopa County with nearby schools including Kyrene Traditional Academy, Kyrene Aprende Middle School, and Corona Del Sol High School.
Ownership History
Date
Name
Owned For
Owner Type
Purchase Details
Closed on
Jun 29, 2000
Sold by
Supardan Hasjim and Supardan Suwarsih
Bought by
Supardan Hasjim and Supardan Suwarsin
Current Estimated Value
Purchase Details
Closed on
Nov 15, 1999
Sold by
Lam Tuan Hong and Lam Bui Hang Thuy
Bought by
Supardan Hasjim and Supardan Suwarsih
Home Financials for this Owner
Home Financials are based on the most recent Mortgage that was taken out on this home.
Original Mortgage
$172,000
Outstanding Balance
$52,791
Interest Rate
7.82%
Mortgage Type
New Conventional
Estimated Equity
$666,689
Purchase Details
Closed on
Nov 7, 1996
Sold by
Pulte Home Corp
Bought by
Lam Tuan Hong and Lam Bui Hang Thuy
Home Financials for this Owner
Home Financials are based on the most recent Mortgage that was taken out on this home.
Original Mortgage
$156,200
Interest Rate
8.06%
Mortgage Type
New Conventional
Create a Home Valuation Report for This Property
The Home Valuation Report is an in-depth analysis detailing your home's value as well as a comparison with similar homes in the area
Home Values in the Area
Average Home Value in this Area
Purchase History
| Date | Buyer | Sale Price | Title Company |
|---|---|---|---|
| Supardan Hasjim | -- | -- | |
| Supardan Hasjim | $215,000 | -- | |
| Lam Tuan Hong | $173,577 | Security Title Agency |
Source: Public Records
Mortgage History
| Date | Status | Borrower | Loan Amount |
|---|---|---|---|
| Open | Supardan Hasjim | $172,000 | |
| Previous Owner | Lam Tuan Hong | $156,200 |
Source: Public Records
Tax History Compared to Growth
Tax History
| Year | Tax Paid | Tax Assessment Tax Assessment Total Assessment is a certain percentage of the fair market value that is determined by local assessors to be the total taxable value of land and additions on the property. | Land | Improvement |
|---|---|---|---|---|
| 2025 | $2,942 | $36,931 | -- | -- |
| 2024 | $2,814 | $35,173 | -- | -- |
| 2023 | $2,814 | $50,550 | $10,110 | $40,440 |
| 2022 | $2,678 | $38,070 | $7,610 | $30,460 |
| 2021 | $2,824 | $36,880 | $7,370 | $29,510 |
| 2020 | $2,760 | $33,730 | $6,740 | $26,990 |
| 2019 | $2,679 | $32,810 | $6,560 | $26,250 |
| 2018 | $2,591 | $31,960 | $6,390 | $25,570 |
| 2017 | $2,469 | $31,320 | $6,260 | $25,060 |
| 2016 | $2,520 | $31,150 | $6,230 | $24,920 |
| 2015 | $2,326 | $29,580 | $5,910 | $23,670 |
Source: Public Records
Map
Nearby Homes
- 3263 W Monterey St
- 3513 W Carla Vista Dr
- 3382 W Monterey St
- 3522 W Detroit St
- 526 N Criss St
- 527 N Pepperwood Ct Unit 3
- 782 N Sicily Dr
- 2725 W Flint St
- 3580 W Dublin St
- 2784 W Del Rio Place
- 3833 W Ivanhoe St
- 991 N Florence Dr
- 3930 W Monterey St Unit 108
- 3987 W Calle Segunda
- 2623 W Ivanhoe St
- 601 N Bullmoose Dr
- 802 N Butte Ave
- 3608 W Fairview Ln
- 2323 W Harrison St
- 3683 W Barcelona Dr
- 3174 W Stephens Place
- 3186 W Stephens Place
- 3185 W Tyson Place
- 3175 W Tyson Place
- 3168 W Stephens Place
- 3195 W Tyson Place
- 3192 W Stephens Place
- 3181 W Stephens Place
- 3165 W Tyson Place
- 3175 W Stephens Place
- 3187 W Stephens Place
- 3169 W Stephens Place
- 3162 W Stephens Place
- 3155 W Tyson Place
- 3193 W Stephens Place
- 3163 W Stephens Place
- 3184 W Tyson Place
- 3210 W Stephens Place
- 3199 W Stephens Place
- 3174 W Tyson Place