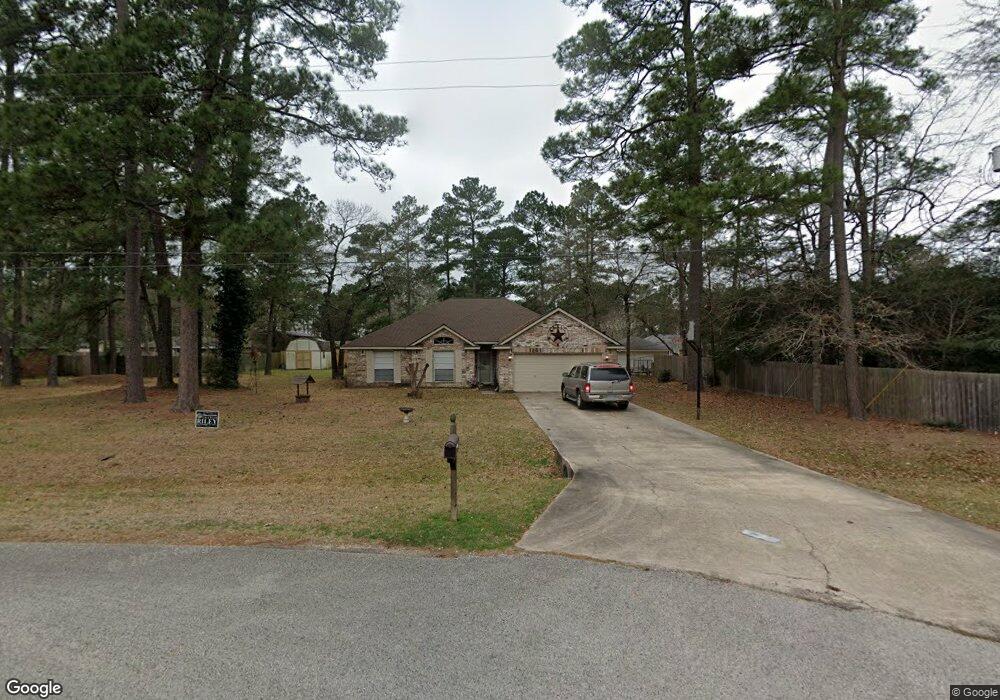
31803 Cottonwood Ln Magnolia, TX 77355
Estimated Value: $325,966 - $410,000
--
Bed
2
Baths
1,850
Sq Ft
$200/Sq Ft
Est. Value
About This Home
This home is located at 31803 Cottonwood Ln, Magnolia, TX 77355 and is currently estimated at $370,742, approximately $200 per square foot. 31803 Cottonwood Ln is a home located in Montgomery County with nearby schools including Magnolia Elementary School, Magnolia Sixth Grade Campus, and Magnolia Junior High School.
Ownership History
Date
Name
Owned For
Owner Type
Purchase Details
Closed on
Dec 29, 2004
Sold by
Miller Jane and Miller William O
Bought by
Riley Charlie D and Riley Deanne
Current Estimated Value
Home Financials for this Owner
Home Financials are based on the most recent Mortgage that was taken out on this home.
Original Mortgage
$121,600
Outstanding Balance
$63,893
Interest Rate
6.37%
Mortgage Type
Stand Alone First
Estimated Equity
$306,849
Purchase Details
Closed on
Aug 29, 2003
Sold by
Davis David Winston and Davis Terri L
Bought by
Miller Jane
Home Financials for this Owner
Home Financials are based on the most recent Mortgage that was taken out on this home.
Original Mortgage
$121,600
Interest Rate
5.71%
Mortgage Type
Purchase Money Mortgage
Purchase Details
Closed on
Sep 27, 1996
Sold by
First Magnolia Realty Inc
Bought by
Burkett Cydne
Purchase Details
Closed on
Apr 14, 1992
Sold by
Ingram William B
Bought by
Riley Charlie Dean
Create a Home Valuation Report for This Property
The Home Valuation Report is an in-depth analysis detailing your home's value as well as a comparison with similar homes in the area
Home Values in the Area
Average Home Value in this Area
Purchase History
| Date | Buyer | Sale Price | Title Company |
|---|---|---|---|
| Riley Charlie D | -- | Texas American Title Company | |
| Miller Jane | -- | Chicago Title | |
| Burkett Cydne | -- | -- | |
| Riley Charlie Dean | -- | -- |
Source: Public Records
Mortgage History
| Date | Status | Borrower | Loan Amount |
|---|---|---|---|
| Open | Riley Charlie D | $121,600 | |
| Previous Owner | Miller Jane | $121,600 | |
| Closed | Riley Charlie D | $30,400 |
Source: Public Records
Tax History Compared to Growth
Tax History
| Year | Tax Paid | Tax Assessment Tax Assessment Total Assessment is a certain percentage of the fair market value that is determined by local assessors to be the total taxable value of land and additions on the property. | Land | Improvement |
|---|---|---|---|---|
| 2025 | $1,724 | $267,301 | -- | -- |
| 2024 | $1,700 | $243,001 | -- | -- |
| 2023 | $1,700 | $220,910 | $32,900 | $310,010 |
| 2022 | $3,544 | $200,830 | $32,900 | $239,640 |
| 2021 | $3,393 | $182,570 | $32,900 | $149,670 |
| 2020 | $4,196 | $207,350 | $32,900 | $174,450 |
| 2019 | $4,303 | $213,650 | $32,900 | $180,750 |
| 2018 | $3,666 | $199,940 | $7,050 | $192,890 |
| 2017 | $3,908 | $184,310 | $7,050 | $192,890 |
| 2016 | $3,553 | $167,550 | $7,050 | $177,300 |
| 2015 | $2,756 | $152,320 | $7,050 | $157,450 |
| 2014 | $2,756 | $138,470 | $7,050 | $131,420 |
Source: Public Records
Map
Nearby Homes
- 31519 Brady St
- 38910 Fm 1774 Rd
- 21119 Aspen Adela Cove
- 21250 Natalia Grove
- 278 Cumberland Forest Dr
- 118 Commerce St
- 0 Commerce
- 28102 Nichols Sawmill Rd
- 119 Magnolia Blvd
- 30812 Willow Green Ln
- 309 Cumberland Forest Dr
- 18618 N Sugar Maple Cir Unit 109
- 309 Country Crossing Cir
- 18523 Burch Creek Ln
- 332 Country Crossing Cir
- 158 Piney Pathway
- 110 Carriage Ct
- 115 Cobblestone Ct
- 100 Sterling River Ln
- 201 Douglas Hills Dr
- 31715 Cottonwood Ln
- 31802 Pine Xin
- 31802 Pine Crossing
- 31806 Pine Crossing
- 31714 Pine Crossing
- 31714 Cottonwood Ln
- 31711 Cottonwood Ln
- 31810 Pine Crossing
- 31710 Pine Crossing
- 31710 Cottonwood Ln
- 414 Meadow Crossing
- 31819 Cottonwood Ln
- 31707 Cottonwood Ln
- 31715 Oak Crossing
- 31803 Pine Crossing
- 31815 Oak Crossing
- 31706 Pine Crossing
- 31814 Pine Crossing
- 31706 Cottonwood Ln
- 31711 Oak Crossing