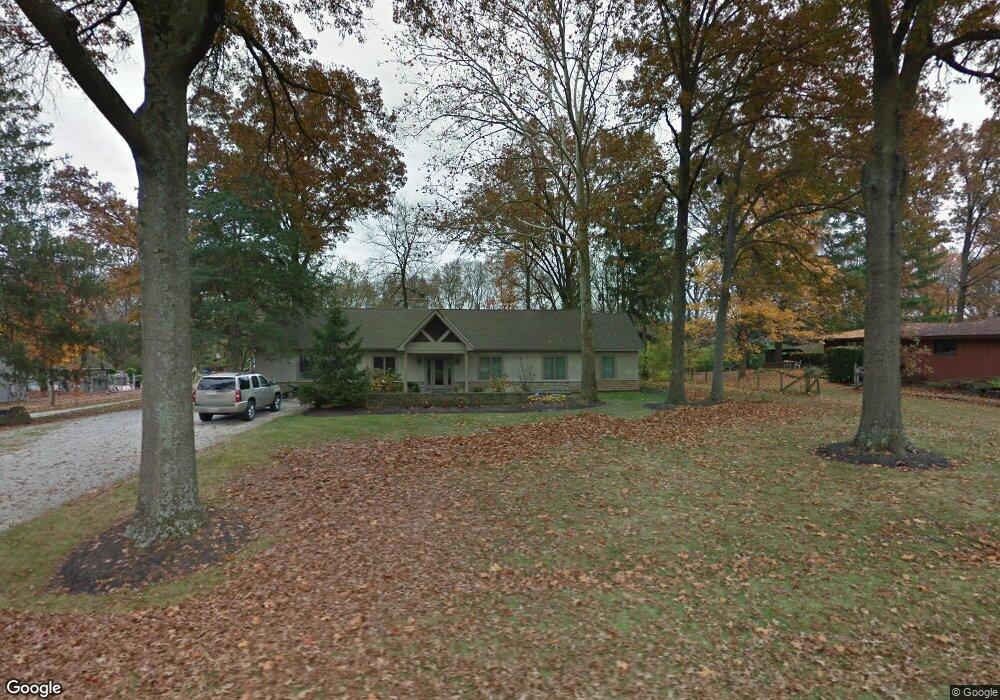
3181 Polley Rd Columbus, OH 43221
Scioto Trace NeighborhoodEstimated Value: $519,000 - $672,636
4
Beds
3
Baths
3,028
Sq Ft
$201/Sq Ft
Est. Value
About This Home
This home is located at 3181 Polley Rd, Columbus, OH 43221 and is currently estimated at $609,159, approximately $201 per square foot. 3181 Polley Rd is a home located in Franklin County with nearby schools including Ridgewood Elementary School, Hilliard Tharp Sixth Grade Elementary School, and Hilliard Weaver Middle School.
Ownership History
Date
Name
Owned For
Owner Type
Purchase Details
Closed on
Sep 24, 2010
Sold by
Sholley Vikki L and Wood David Scott
Bought by
Wood Vikki S and Wood David Scott
Current Estimated Value
Home Financials for this Owner
Home Financials are based on the most recent Mortgage that was taken out on this home.
Original Mortgage
$260,000
Outstanding Balance
$171,687
Interest Rate
4.75%
Mortgage Type
New Conventional
Estimated Equity
$437,472
Purchase Details
Closed on
Oct 15, 2008
Sold by
Sholley Vikki L
Bought by
Sholley Vikki L and Wood David Scott
Purchase Details
Closed on
Jul 17, 2008
Sold by
Schackne Marion C and Marion C Schackne Trust
Bought by
Sholley Vikki L
Home Financials for this Owner
Home Financials are based on the most recent Mortgage that was taken out on this home.
Original Mortgage
$176,700
Interest Rate
6.15%
Mortgage Type
Purchase Money Mortgage
Purchase Details
Closed on
Dec 10, 1991
Create a Home Valuation Report for This Property
The Home Valuation Report is an in-depth analysis detailing your home's value as well as a comparison with similar homes in the area
Home Values in the Area
Average Home Value in this Area
Purchase History
| Date | Buyer | Sale Price | Title Company |
|---|---|---|---|
| Wood Vikki S | -- | Lakeside Ti | |
| Sholley Vikki L | $83,200 | Lakeside Ti | |
| Sholley Vikki L | $186,000 | Lakeside Ti | |
| -- | -- | -- |
Source: Public Records
Mortgage History
| Date | Status | Borrower | Loan Amount |
|---|---|---|---|
| Open | Wood Vikki S | $260,000 | |
| Closed | Sholley Vikki L | $176,700 |
Source: Public Records
Tax History
| Year | Tax Paid | Tax Assessment Tax Assessment Total Assessment is a certain percentage of the fair market value that is determined by local assessors to be the total taxable value of land and additions on the property. | Land | Improvement |
|---|---|---|---|---|
| 2025 | $18,266 | $193,730 | $53,450 | $140,280 |
| 2024 | $18,266 | $193,730 | $53,450 | $140,280 |
| 2023 | $10,567 | $193,725 | $53,445 | $140,280 |
| 2022 | $15,020 | $145,360 | $38,610 | $106,750 |
| 2021 | $10,009 | $145,360 | $38,610 | $106,750 |
| 2020 | $9,984 | $145,360 | $38,610 | $106,750 |
| 2019 | $8,049 | $99,370 | $29,680 | $69,690 |
| 2018 | $8,410 | $104,650 | $29,680 | $74,970 |
| 2017 | $8,445 | $104,650 | $29,680 | $74,970 |
| 2016 | $8,861 | $101,510 | $27,410 | $74,100 |
| 2015 | $8,373 | $101,510 | $27,410 | $74,100 |
| 2014 | $7,336 | $88,730 | $27,410 | $61,320 |
| 2013 | $3,724 | $88,725 | $27,405 | $61,320 |
Source: Public Records
Map
Nearby Homes
- 3000 Scioto Place
- 3414 Loire Ln
- 3507 River Avon Cir
- 3167 Griggsview Ct
- 3827 Rockpointe Dr
- 3493 Sunset Dr Unit 3493
- 3246 Summerdale Ln Unit 34
- 3231 Stonecrest Ct Unit 40
- 3441 River Place Dr
- 3120 Capstone Way
- 3479 Fishinger Mill Dr
- 3660 Hilliard Station Rd Unit 3660
- 3423 Ledge Ln
- 3377 Eastwoodlands Trail Unit 3377
- 3422 Smiley's Corner
- 3705 Hilliard Station Rd Unit 3705
- 3950 Riverside Dr
- 3558 Kinsale Head Dr Unit 560
- 2729 Eastcleft Dr
- 3757 Mill Stream Dr Unit 12
- 3201 Polley Rd
- 3161 Polley Rd
- 3178 Polley Rd
- 3196 Polley Rd
- 3219 Polley Rd
- 3156 Polley Rd
- 3141 Polley Rd
- 3100 Scioto Trace
- 3090 Scioto Trace
- 3108 Scioto Trace
- 3076 Scioto Trace
- 3140 Polley Rd
- 3121 Polley Rd
- 3120 Scioto Trace
- 3062 Scioto Trace
- 3241 Polley Rd
- 3034 Scioto Place
- 3240 Polley Rd
- 3042 Scioto Place
- 3103 Scioto Trace
Your Personal Tour Guide
Ask me questions while you tour the home.