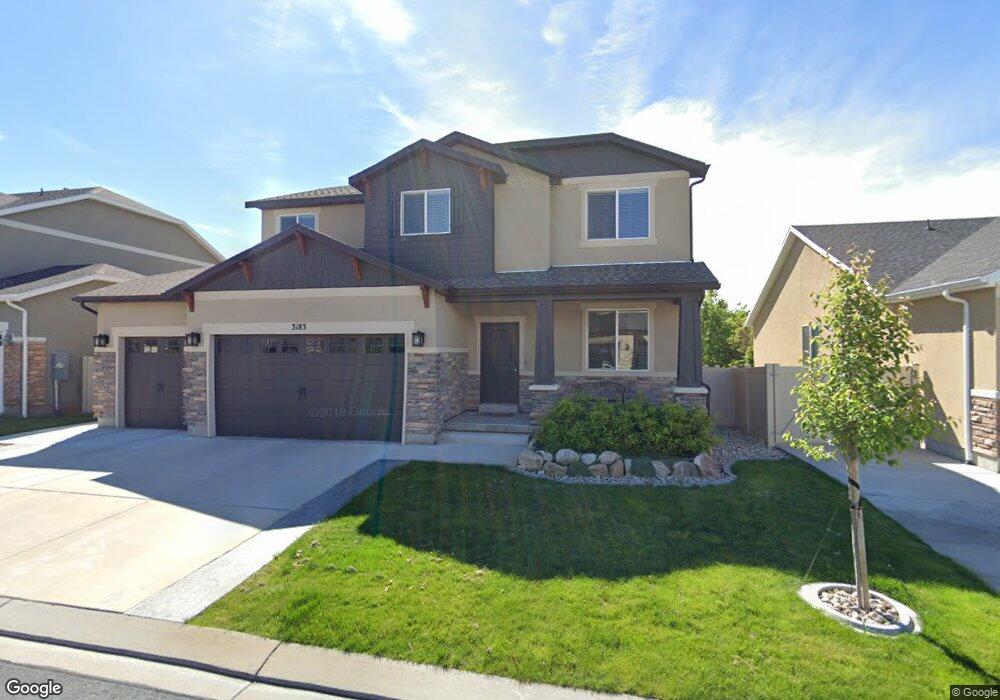
3183 W Wild Flower Ln Lehi, UT 84043
Thanksgiving NeighborhoodEstimated Value: $723,000 - $798,000
5
Beds
4
Baths
3,761
Sq Ft
$201/Sq Ft
Est. Value
About This Home
This home is located at 3183 W Wild Flower Ln, Lehi, UT 84043 and is currently estimated at $755,782, approximately $200 per square foot. 3183 W Wild Flower Ln is a home located in Utah County with nearby schools including Fox Hollow Elementary School, Skyridge High School, and Ignite Entrepreneurship Academy.
Ownership History
Date
Name
Owned For
Owner Type
Purchase Details
Closed on
Jun 4, 2020
Sold by
Da Rocha Jean Moroni C and Rocha Michelle M
Bought by
Coton Matthew A
Current Estimated Value
Home Financials for this Owner
Home Financials are based on the most recent Mortgage that was taken out on this home.
Original Mortgage
$486,400
Outstanding Balance
$431,156
Interest Rate
3.2%
Mortgage Type
New Conventional
Estimated Equity
$324,626
Purchase Details
Closed on
Aug 13, 2012
Sold by
Mcarthur Homes Tm Lc
Bought by
Rocha Jean Moroni C Da and Rocha Michelle D
Home Financials for this Owner
Home Financials are based on the most recent Mortgage that was taken out on this home.
Original Mortgage
$245,620
Interest Rate
3.62%
Mortgage Type
New Conventional
Purchase Details
Closed on
Mar 30, 2012
Sold by
Gtr Investmetns Llc
Bought by
Mcarthur Homes Tm Lc
Create a Home Valuation Report for This Property
The Home Valuation Report is an in-depth analysis detailing your home's value as well as a comparison with similar homes in the area
Home Values in the Area
Average Home Value in this Area
Purchase History
| Date | Buyer | Sale Price | Title Company |
|---|---|---|---|
| Coton Matthew A | -- | Investors Title Ins Agcy Inc | |
| Rocha Jean Moroni C Da | -- | Surety Title | |
| Mcarthur Homes Tm Lc | -- | None Available |
Source: Public Records
Mortgage History
| Date | Status | Borrower | Loan Amount |
|---|---|---|---|
| Open | Coton Matthew A | $486,400 | |
| Previous Owner | Rocha Jean Moroni C Da | $245,620 |
Source: Public Records
Tax History Compared to Growth
Tax History
| Year | Tax Paid | Tax Assessment Tax Assessment Total Assessment is a certain percentage of the fair market value that is determined by local assessors to be the total taxable value of land and additions on the property. | Land | Improvement |
|---|---|---|---|---|
| 2025 | $2,976 | $373,395 | $250,100 | $428,800 |
| 2024 | $2,976 | $348,315 | $0 | $0 |
| 2023 | $2,798 | $355,575 | $0 | $0 |
| 2022 | $2,933 | $361,295 | $0 | $0 |
| 2021 | $2,639 | $491,400 | $144,700 | $346,700 |
| 2020 | $2,415 | $444,500 | $134,000 | $310,500 |
| 2019 | $2,181 | $417,400 | $134,000 | $283,400 |
| 2018 | $2,138 | $386,800 | $124,200 | $262,600 |
| 2017 | $2,046 | $196,790 | $0 | $0 |
| 2016 | $2,064 | $184,195 | $0 | $0 |
| 2015 | $1,985 | $168,135 | $0 | $0 |
| 2014 | $1,937 | $163,075 | $0 | $0 |
Source: Public Records
Map
Nearby Homes
- 3741 N Meadow Springs Ln
- 3477 N Bear Hollow Way
- 3162 W Desert Lily Dr
- 3147 W Davencourt Loop
- 3931 N Davencourt Loop
- 4328 W Harvest Cove Unit 5
- 281 E Levengrove Dr
- 269 E Levengrove Dr Unit 182
- 269 E Levengrove Dr
- 334-1081 E Glencoe Dr
- 4253 N Buckstone Way Unit 1368
- 4176 N Pilgrims Cir
- 4257 N Buckstone Way Unit 1369
- 4261 N Buckstone Way Unit 1370
- 4265 N Buckstone Way Unit 1371
- 68-185 E Talisman Ave
- 4269 N Buckstone Way Unit 1372
- 4273 N Buckstone Way Unit 1373
- 2886 Desert Forest Ln
- 4063 New Land Loop
- 3171 W Wild Flower Ln Unit LOT310
- 3171 W Wild Flower Ln
- 3195 W Wild Flower Ln
- 3163 W Wild Flower Ln
- 3184 W Wild Flower Ln
- 3168 W Wild Flower Ln
- 3206 W Wild Flower Ln
- 3155 W Wild Flower Ln
- 3154 W Wild Flower Ln
- 3160 W Clubhouse Dr
- 3147 W Wild Flower Ln
- 3130 W Maple Loop Dr Unit 120
- 3613 N Wild Flower Ct
- 3221 W Blanket Flower Way
- 3146 W Wild Flower Ln
- 3135 W Wild Flower Ln
- 3621 N Wild Flower Ct
- 3474 N Bear Hollow Way
- 3486 N Bear Hollow Way
- 3233 W Blanket Flower Way