Estimated Value: $227,327 - $307,000
--
Bed
2
Baths
1,464
Sq Ft
$189/Sq Ft
Est. Value
About This Home
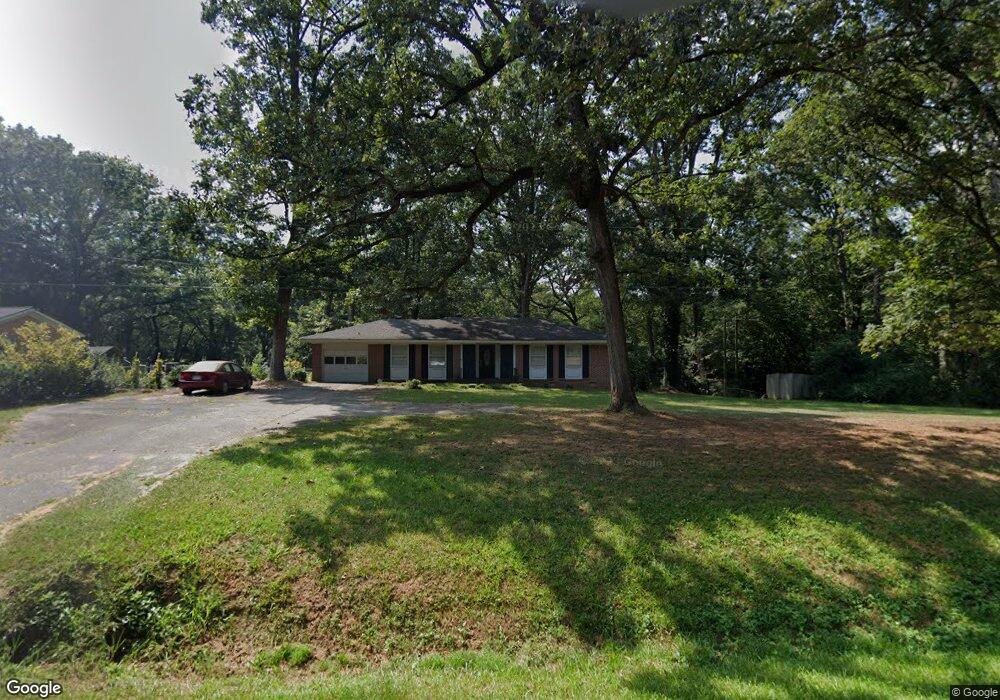
This home is located at 3184 Highway 106 S, Hull, GA 30646 and is currently estimated at $276,332, approximately $188 per square foot. 3184 Highway 106 S is a home located in Madison County with nearby schools including Madison County High School and Union Christian Academy.
Ownership History
Date
Name
Owned For
Owner Type
Purchase Details
Closed on
Dec 10, 2010
Sold by
Bryant Cathy S
Bought by
Bryant Jonathan W
Current Estimated Value
Home Financials for this Owner
Home Financials are based on the most recent Mortgage that was taken out on this home.
Original Mortgage
$66,444
Interest Rate
4.18%
Mortgage Type
Future Advance Clause Open End Mortgage
Purchase Details
Closed on
Jun 27, 2007
Sold by
Bryant Cathy S
Bought by
Bryant Jonathan W
Purchase Details
Closed on
May 7, 2007
Sold by
Bryant Jonathan W
Bought by
Bryant Cathy S
Purchase Details
Closed on
Apr 18, 2003
Sold by
Altegra Credit Compa
Bought by
Bryant Cathy S and Bryant Johny W
Purchase Details
Closed on
Jun 4, 2002
Sold by
Whitehead Ralph
Bought by
Altegra Credit Compa
Purchase Details
Closed on
Apr 29, 1998
Sold by
Whitehead Sonia L
Bought by
Whitehead Ralph
Purchase Details
Closed on
Jan 1, 1992
Bought by
Whitehead Ralph
Create a Home Valuation Report for This Property
The Home Valuation Report is an in-depth analysis detailing your home's value as well as a comparison with similar homes in the area
Home Values in the Area
Average Home Value in this Area
Purchase History
| Date | Buyer | Sale Price | Title Company |
|---|---|---|---|
| Bryant Jonathan W | -- | -- | |
| Bryant Jonathan W | -- | -- | |
| Bryant Cathy S | -- | -- | |
| Bryant Cathy S | $61,000 | -- | |
| Altegra Credit Compa | -- | -- | |
| Whitehead Ralph | -- | -- | |
| Whitehead Ralph | $55,900 | -- |
Source: Public Records
Mortgage History
| Date | Status | Borrower | Loan Amount |
|---|---|---|---|
| Closed | Bryant Jonathan W | $66,444 |
Source: Public Records
Tax History Compared to Growth
Tax History
| Year | Tax Paid | Tax Assessment Tax Assessment Total Assessment is a certain percentage of the fair market value that is determined by local assessors to be the total taxable value of land and additions on the property. | Land | Improvement |
|---|---|---|---|---|
| 2024 | $1,335 | $53,276 | $9,594 | $43,682 |
| 2023 | $1,487 | $48,696 | $7,995 | $40,701 |
| 2022 | $1,082 | $41,231 | $5,498 | $35,733 |
| 2021 | $923 | $32,250 | $5,498 | $26,752 |
| 2020 | $905 | $31,450 | $4,698 | $26,752 |
| 2019 | $897 | $30,830 | $4,698 | $26,132 |
| 2018 | $849 | $29,209 | $4,299 | $24,910 |
| 2017 | $856 | $29,722 | $3,998 | $25,724 |
| 2016 | $670 | $25,349 | $3,634 | $21,715 |
| 2015 | $670 | $25,349 | $3,634 | $21,715 |
| 2014 | $675 | $25,367 | $3,382 | $21,986 |
| 2013 | -- | $25,367 | $3,382 | $21,986 |
Source: Public Records
Map
Nearby Homes
- 0 Nowhere Rd Unit 10532129
- 495 Hanley Rd
- 280 Corey Dr
- 136 Wedgewood Dr
- 110 Williams Wilson Rd
- 25 Williams Wilson Rd
- 197 Joan Smith Rd
- 2888 Moons Grove Church Rd
- 3655 Neese Commerce Rd
- 0 Stone Stewart Rd Unit 7519457
- 0 Stone Stewart Rd Unit 10452697
- 0 Stone Stewart Rd Unit 1023553
- 832 Stone Stewart Rd
- 1191 Aderhold Rogers Rd
- 1246 Stone Stewart Rd
- 135 Woodpecker Pte
- 4274 Highway 98 W
- 135 Adams Duncan Rd
- 5492 Georgia 98
- 135 Woodpecker Point
- 3184 Hwy 106s
- 3204 Highway 106 S
- 3234 Georgia 106
- 3234 Highway 106 S
- 3234 Hwy 106s
- 3260 Georgia 106 Unit 3
- 3260 Georgia 106
- 3260 Highway 106 S Unit 3
- 3260 Highway 106 S
- 3260 Hwy 106s
- 3292 Highway 106 S
- 3306 Hwy 106s
- 3306 Highway 106 S
- 3300 Highway 106 S
- 3300 Highway 106 S
- 3300 Highway 106 S
- 3300 Highway 106 S
- 3300 Highway 106s
- 201 Jj and G Dr
- 3300 Georgia 106