3185 Stonecrest Dr Unit 16 Cumming, GA 30041
Big Creek NeighborhoodEstimated Value: $715,433 - $884,000
5
Beds
4
Baths
3,373
Sq Ft
$246/Sq Ft
Est. Value
About This Home
This home is located at 3185 Stonecrest Dr Unit 16, Cumming, GA 30041 and is currently estimated at $829,858, approximately $246 per square foot. 3185 Stonecrest Dr Unit 16 is a home located in Forsyth County with nearby schools including Brookwood Elementary School, Piney Grove Middle School, and Denmark High School.
Ownership History
Date
Name
Owned For
Owner Type
Purchase Details
Closed on
Sep 13, 2016
Sold by
Hp Georgia I Llc
Bought by
Hpa Borrower 2016 2 Llc
Current Estimated Value
Purchase Details
Closed on
May 19, 2016
Sold by
Ewald David A
Bought by
Hp Georgia I Llc
Purchase Details
Closed on
Mar 6, 2015
Sold by
Davis Arthur
Bought by
Ewald David A and Ewald Deborah E
Home Financials for this Owner
Home Financials are based on the most recent Mortgage that was taken out on this home.
Original Mortgage
$369,000
Interest Rate
3.69%
Purchase Details
Closed on
Jul 15, 2011
Sold by
Km Homes Llc
Bought by
Davis Arthur
Home Financials for this Owner
Home Financials are based on the most recent Mortgage that was taken out on this home.
Original Mortgage
$303,475
Interest Rate
4.25%
Mortgage Type
FHA
Create a Home Valuation Report for This Property
The Home Valuation Report is an in-depth analysis detailing your home's value as well as a comparison with similar homes in the area
Home Values in the Area
Average Home Value in this Area
Purchase History
| Date | Buyer | Sale Price | Title Company |
|---|---|---|---|
| Hpa Borrower 2016 2 Llc | -- | -- | |
| Hp Georgia I Llc | $425,000 | -- | |
| Ewald David A | $410,000 | -- | |
| Davis Arthur | $311,400 | -- |
Source: Public Records
Mortgage History
| Date | Status | Borrower | Loan Amount |
|---|---|---|---|
| Previous Owner | Ewald David A | $369,000 | |
| Previous Owner | Davis Arthur | $303,475 | |
| Previous Owner | Davis Arthur | $311,369 |
Source: Public Records
Tax History Compared to Growth
Tax History
| Year | Tax Paid | Tax Assessment Tax Assessment Total Assessment is a certain percentage of the fair market value that is determined by local assessors to be the total taxable value of land and additions on the property. | Land | Improvement |
|---|---|---|---|---|
| 2025 | $6,717 | $282,596 | $74,000 | $208,596 |
| 2024 | $6,717 | $270,752 | $68,000 | $202,752 |
| 2023 | $6,127 | $248,928 | $60,000 | $188,928 |
| 2022 | $5,506 | $176,752 | $50,000 | $126,752 |
| 2021 | $4,881 | $176,752 | $50,000 | $126,752 |
| 2020 | $5,041 | $182,560 | $50,000 | $132,560 |
| 2019 | $4,656 | $168,376 | $50,000 | $118,376 |
| 2018 | $4,708 | $170,236 | $28,000 | $142,236 |
| 2017 | $4,552 | $164,028 | $28,000 | $136,028 |
| 2016 | $4,358 | $163,988 | $31,028 | $132,960 |
| 2015 | $4,115 | $147,988 | $28,000 | $119,988 |
| 2014 | $3,320 | $125,388 | $0 | $0 |
Source: Public Records
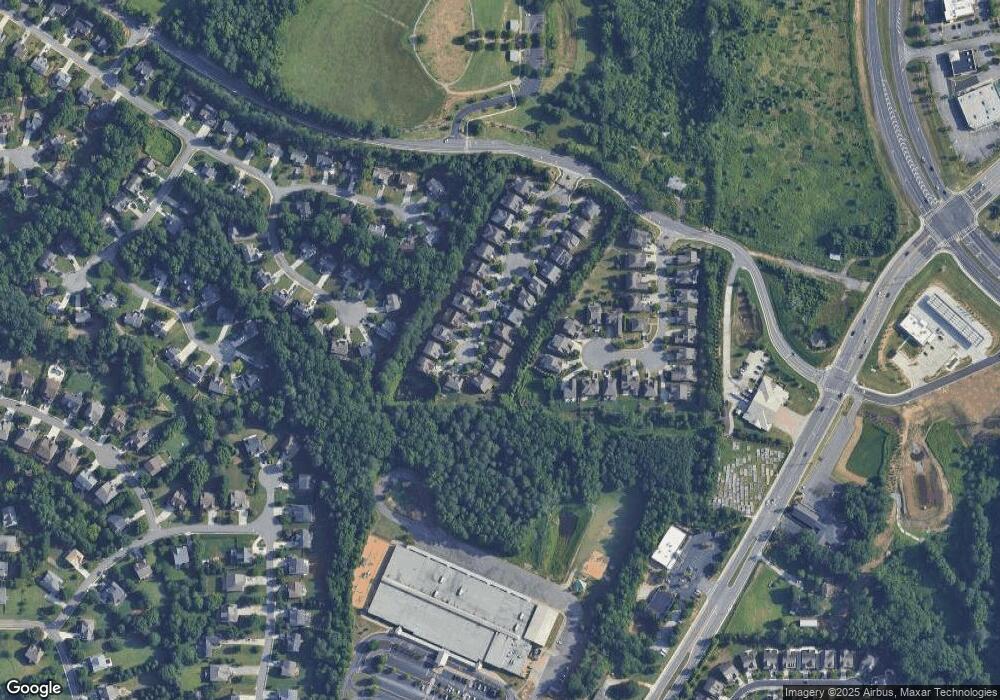
Map
Nearby Homes
- 3250 Caney Estates Place
- 3115 Arbor Song Ct
- 2875 Caney Rd
- 3030 Brookwater Dr Unit 1
- 3070 Brookwater Dr
- 3180 Caney Creek Ln
- 2005 Brook Meadow Dr
- 3055 Rocky Brook Dr
- 3585 Lakeheath Dr
- St. Ives Plan at The Parc at Caney
- Heritage Manor Plan at The Parc at Caney
- Turnberry Park Plan at The Parc at Caney
- Chatham Place Plan at The Parc at Caney
- 3715 Lakeheath Dr
- 7530 Newstead Dr
- 3730 Lakeheath Dr
- 3150 Thistle Trail
- 2940 Bentbill Crossing
- 1250 Rosewood Dr
- 4020 Bridle Ridge Dr
- 3185 Stonecrest Dr
- 3175 Stonecrest Dr
- 3195 Stonecrest Dr
- 3205 Stonecrest Dr
- 3165 Stonecrest Dr
- 3265 Caney Estates Place
- 3155 Stonecrest Dr
- 3114 Caney Rd
- 3180 Stonecrest Dr
- 3215 Stonecrest Dr
- 3190 Stonecrest Dr
- 3170 Stonecrest Dr
- 3260 Caney Estates Place
- 3210 Stonecrest Dr
- 3160 Stonecrest Dr
- 3220 Stonecrest Dr
- 3135 Stonecrest Dr
- 3255 Caney Estates Place
- 3150 Stonecrest Dr
- 0 Stonecrest Dr Unit 7479946