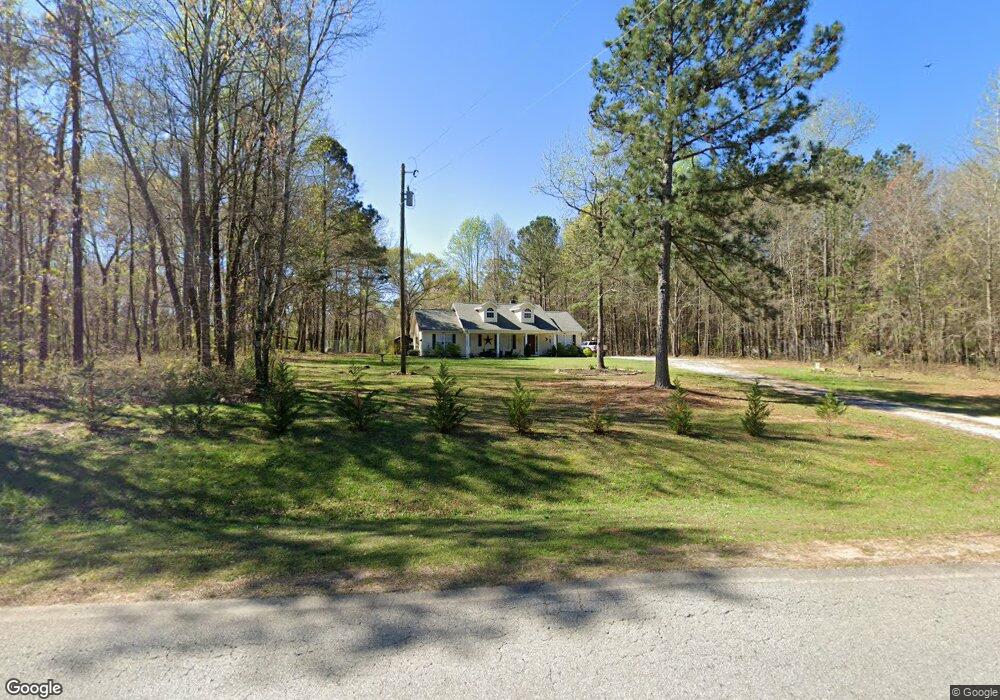
3189 Allie Rd Greenville, GA 30222
Estimated Value: $225,000 - $334,000
3
Beds
2
Baths
1,722
Sq Ft
$169/Sq Ft
Est. Value
About This Home
This home is located at 3189 Allie Rd, Greenville, GA 30222 and is currently estimated at $291,055, approximately $169 per square foot. 3189 Allie Rd is a home located in Meriwether County with nearby schools including George E. Washington Elementary School.
Ownership History
Date
Name
Owned For
Owner Type
Purchase Details
Closed on
Aug 23, 2019
Sold by
Jb Communities Llc
Bought by
Blalock Michael
Current Estimated Value
Home Financials for this Owner
Home Financials are based on the most recent Mortgage that was taken out on this home.
Original Mortgage
$142,405
Outstanding Balance
$124,720
Interest Rate
3.7%
Mortgage Type
New Conventional
Estimated Equity
$166,335
Purchase Details
Closed on
Feb 13, 2019
Sold by
Madan Gobind
Bought by
Jb Communities Llc
Purchase Details
Closed on
Sep 18, 2018
Sold by
Pheasant Hollow Development Llc
Bought by
Madan Gobind
Purchase Details
Closed on
Feb 13, 2001
Sold by
Frith James L and Frith E
Bought by
Pheasant Hollow Deve
Purchase Details
Closed on
May 22, 2000
Sold by
Frith James L and Frith E
Bought by
Frith James L and Frith E
Purchase Details
Closed on
Aug 12, 1996
Sold by
Frith James L
Bought by
Frith James L and Frith E
Create a Home Valuation Report for This Property
The Home Valuation Report is an in-depth analysis detailing your home's value as well as a comparison with similar homes in the area
Home Values in the Area
Average Home Value in this Area
Purchase History
| Date | Buyer | Sale Price | Title Company |
|---|---|---|---|
| Blalock Michael | $149,900 | -- | |
| Jb Communities Llc | $45,000 | -- | |
| Madan Gobind | $18,400 | -- | |
| Pheasant Hollow Deve | -- | -- | |
| Frith James L | -- | -- | |
| Frith James L | -- | -- |
Source: Public Records
Mortgage History
| Date | Status | Borrower | Loan Amount |
|---|---|---|---|
| Open | Blalock Michael | $142,405 |
Source: Public Records
Tax History Compared to Growth
Tax History
| Year | Tax Paid | Tax Assessment Tax Assessment Total Assessment is a certain percentage of the fair market value that is determined by local assessors to be the total taxable value of land and additions on the property. | Land | Improvement |
|---|---|---|---|---|
| 2024 | $2,866 | $86,280 | $4,480 | $81,800 |
| 2023 | $1,896 | $54,920 | $4,480 | $50,440 |
| 2022 | $1,896 | $54,920 | $4,480 | $50,440 |
| 2021 | $1,925 | $54,920 | $4,480 | $50,440 |
| 2020 | $1,940 | $54,920 | $4,480 | $50,440 |
| 2019 | $743 | $20,960 | $4,480 | $16,480 |
| 2018 | $750 | $20,960 | $4,480 | $16,480 |
| 2017 | $758 | $20,960 | $4,480 | $16,480 |
| 2016 | $690 | $20,960 | $4,480 | $16,480 |
| 2015 | $691 | $20,960 | $4,480 | $16,480 |
| 2014 | $691 | $20,960 | $4,480 | $16,480 |
| 2013 | -- | $20,960 | $4,480 | $16,480 |
Source: Public Records
Map
Nearby Homes
- 2114 Allie Rd
- 1511 Forrest Rd
- 964 Forrest Rd
- 865 Forrest Rd
- 500 Todd Rd
- 2638 Jarrell Rd
- 5582 Georgia 100
- The Bradford Plan at Roosevelt Hwy
- The Millie Plan at Roosevelt Hwy
- 6608 Highway 100
- 661 Hugh O Neal Rd
- 95 Amanda Ct
- 0 Amanda Ct Unit 10552958
- 0 Amanda Ct Unit 7604243
- 209 Hannah Ct
- 3535 Forrest Rd
- The Millie Plan at Andrews Mill
- 0 Andrews Mill Rd Unit LOT 2 10581693
- 0 Andrews Mill Rd Unit LOT 1 10571858
- The Millie Plan at Primrose Road
- 3189 Allie Rd Unit 3.10 acres
- 3207 Allie Rd
- 3083 Allie Rd
- 105 Maddox Cir
- 3206 Allie Rd Unit 1
- 3206 Allie Rd
- 3031 Allie Rd
- 110 Maddox Cir
- 99 Maddox Cir
- 0 Maddox Cir Unit 7410137
- 0 Maddox Cir Unit 7260747
- 3326 Allie Rd Unit track A lot 1
- 3013 Allie Rd
- 2967 Allie Rd
- 312 Pheasant Hollow Dr
- 366 Pheasant Hollow Dr
- 566 Pheasant Hollow Dr
- 3436 Allie Rd Unit track c lot 2
- 654 Pheasant Hollow Dr
- 180 Dean Rd