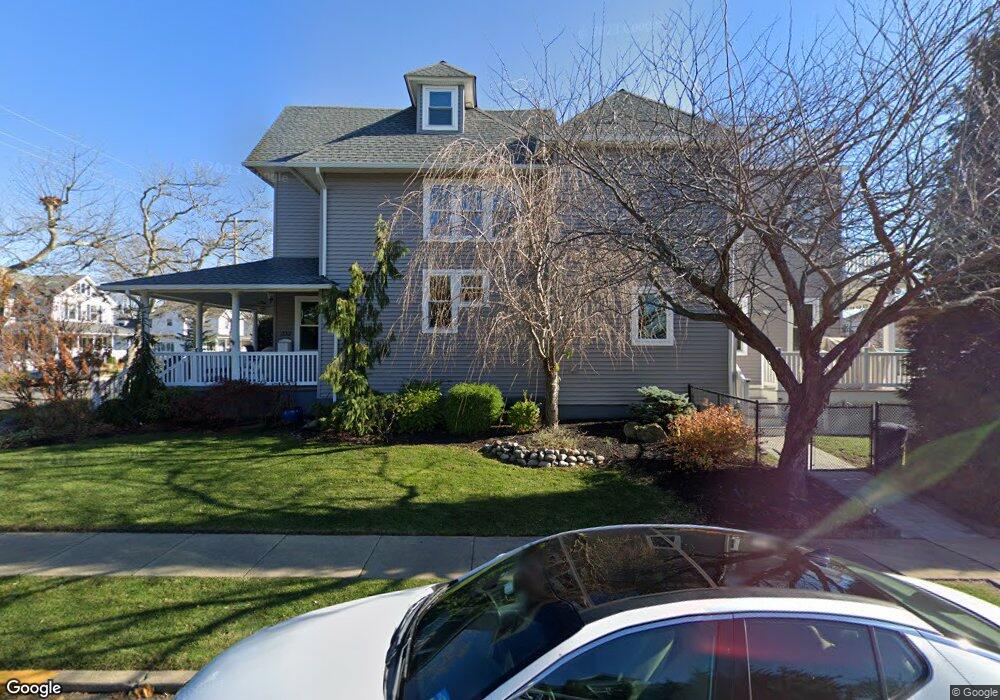
319 5th Ave Belmar, NJ 07719
Estimated Value: $1,335,000 - $2,287,000
3
Beds
3
Baths
2,977
Sq Ft
$613/Sq Ft
Est. Value
About This Home
This home is located at 319 5th Ave, Belmar, NJ 07719 and is currently estimated at $1,824,371, approximately $612 per square foot. 319 5th Ave is a home located in Monmouth County with nearby schools including Belmar Elementary School, St. Rose Grammar School, and St Rose High School.
Ownership History
Date
Name
Owned For
Owner Type
Purchase Details
Closed on
Jun 12, 2009
Sold by
Us Bank National Association
Bought by
Pfeifer Mark and Pfeifer Angela
Current Estimated Value
Purchase Details
Closed on
May 12, 2006
Sold by
Burns David W
Bought by
Matthews Peter J
Home Financials for this Owner
Home Financials are based on the most recent Mortgage that was taken out on this home.
Original Mortgage
$675,000
Interest Rate
1.25%
Mortgage Type
Adjustable Rate Mortgage/ARM
Purchase Details
Closed on
May 16, 1995
Sold by
Barrett John
Bought by
Burns David and Burns Joyceann
Home Financials for this Owner
Home Financials are based on the most recent Mortgage that was taken out on this home.
Original Mortgage
$137,000
Interest Rate
8.33%
Create a Home Valuation Report for This Property
The Home Valuation Report is an in-depth analysis detailing your home's value as well as a comparison with similar homes in the area
Home Values in the Area
Average Home Value in this Area
Purchase History
| Date | Buyer | Sale Price | Title Company |
|---|---|---|---|
| Pfeifer Mark | $502,000 | Multiple | |
| Matthews Peter J | $900,000 | -- | |
| Burns David | $152,500 | -- |
Source: Public Records
Mortgage History
| Date | Status | Borrower | Loan Amount |
|---|---|---|---|
| Previous Owner | Matthews Peter J | $675,000 | |
| Previous Owner | Burns David | $137,000 |
Source: Public Records
Tax History Compared to Growth
Tax History
| Year | Tax Paid | Tax Assessment Tax Assessment Total Assessment is a certain percentage of the fair market value that is determined by local assessors to be the total taxable value of land and additions on the property. | Land | Improvement |
|---|---|---|---|---|
| 2025 | $13,678 | $940,100 | $600,000 | $340,100 |
| 2024 | $13,218 | $940,100 | $600,000 | $340,100 |
| 2023 | $13,218 | $940,100 | $600,000 | $340,100 |
| 2022 | $12,757 | $940,100 | $600,000 | $340,100 |
| 2021 | $12,757 | $940,100 | $600,000 | $340,100 |
| 2020 | $12,644 | $940,100 | $600,000 | $340,100 |
| 2019 | $12,644 | $940,100 | $600,000 | $340,100 |
| 2018 | $11,610 | $940,100 | $600,000 | $340,100 |
| 2017 | $11,328 | $940,100 | $600,000 | $340,100 |
| 2016 | $10,434 | $546,000 | $245,000 | $301,000 |
| 2015 | $10,478 | $546,000 | $245,000 | $301,000 |
| 2014 | $10,275 | $531,000 | $230,000 | $301,000 |
Source: Public Records
Map
Nearby Homes