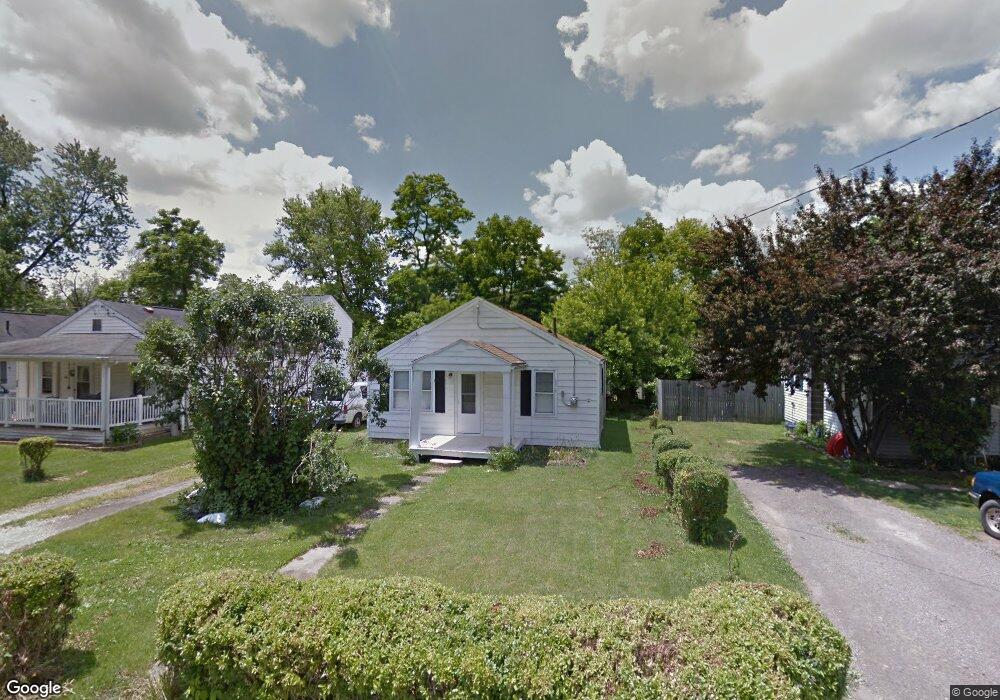
319 7th Ave Mansfield, OH 44905
Estimated Value: $72,978 - $92,000
3
Beds
1
Bath
866
Sq Ft
$95/Sq Ft
Est. Value
About This Home
This home is located at 319 7th Ave, Mansfield, OH 44905 and is currently estimated at $82,245, approximately $94 per square foot. 319 7th Ave is a home located in Richland County with nearby schools including Madison High School, Temple-Christian School, and St. Peter's Elementary/Montessori School.
Ownership History
Date
Name
Owned For
Owner Type
Purchase Details
Closed on
Feb 18, 2022
Sold by
Rosa Lambright
Bought by
Gamble Steven William and Gamble Heather
Current Estimated Value
Home Financials for this Owner
Home Financials are based on the most recent Mortgage that was taken out on this home.
Original Mortgage
$40,000
Interest Rate
3.55%
Mortgage Type
Seller Take Back
Purchase Details
Closed on
Jan 24, 2022
Sold by
Carol Ann Bevier Trust
Bought by
Lambright Rosa
Home Financials for this Owner
Home Financials are based on the most recent Mortgage that was taken out on this home.
Original Mortgage
$40,000
Interest Rate
3.55%
Mortgage Type
Seller Take Back
Create a Home Valuation Report for This Property
The Home Valuation Report is an in-depth analysis detailing your home's value as well as a comparison with similar homes in the area
Home Values in the Area
Average Home Value in this Area
Purchase History
| Date | Buyer | Sale Price | Title Company |
|---|---|---|---|
| Gamble Steven William | $125 | Weldon Huston & Keyser Llp | |
| Lambright Rosa | -- | Weldon Huston & Keyser Llp |
Source: Public Records
Mortgage History
| Date | Status | Borrower | Loan Amount |
|---|---|---|---|
| Closed | Gamble Steven William | $40,000 |
Source: Public Records
Tax History
| Year | Tax Paid | Tax Assessment Tax Assessment Total Assessment is a certain percentage of the fair market value that is determined by local assessors to be the total taxable value of land and additions on the property. | Land | Improvement |
|---|---|---|---|---|
| 2024 | $430 | $10,900 | $3,690 | $7,210 |
| 2023 | $440 | $10,900 | $3,690 | $7,210 |
| 2022 | $511 | $11,700 | $3,840 | $7,860 |
| 2021 | $129 | $11,700 | $3,840 | $7,860 |
| 2020 | $130 | $11,700 | $3,840 | $7,860 |
| 2019 | $60 | $9,970 | $3,260 | $6,710 |
| 2018 | $59 | $9,970 | $3,260 | $6,710 |
| 2017 | $58 | $9,970 | $3,260 | $6,710 |
| 2016 | $38 | $9,530 | $3,160 | $6,370 |
| 2015 | $37 | $9,530 | $3,160 | $6,370 |
| 2014 | $37 | $9,530 | $3,160 | $6,370 |
| 2012 | $219 | $9,820 | $3,260 | $6,560 |
Source: Public Records
Map
Nearby Homes
Your Personal Tour Guide
Ask me questions while you tour the home.