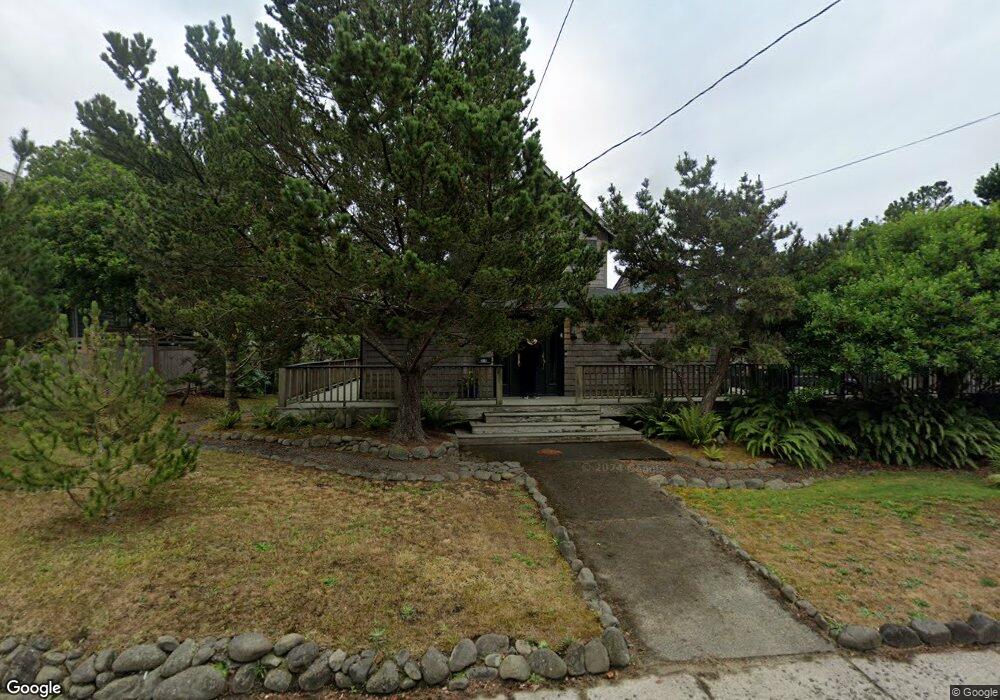
319 8th Ave Seaside, OR 97138
Estimated Value: $632,346 - $971,000
4
Beds
3
Baths
2,571
Sq Ft
$319/Sq Ft
Est. Value
About This Home
This home is located at 319 8th Ave, Seaside, OR 97138 and is currently estimated at $821,087, approximately $319 per square foot. 319 8th Ave is a home located in Clatsop County with nearby schools including Seaside High School.
Ownership History
Date
Name
Owned For
Owner Type
Purchase Details
Closed on
Feb 28, 2024
Sold by
Klass Family Trust
Bought by
Reich Kayla K
Current Estimated Value
Purchase Details
Closed on
Feb 8, 2024
Sold by
Mendelson Klass Allene
Bought by
Klass Family Trust and Klass
Purchase Details
Closed on
Feb 16, 2005
Sold by
Klass Allene Mendelson
Bought by
Klass Gregory S
Purchase Details
Closed on
Dec 29, 2004
Sold by
Klass Allene Mendelson
Bought by
Klass Gregory S
Create a Home Valuation Report for This Property
The Home Valuation Report is an in-depth analysis detailing your home's value as well as a comparison with similar homes in the area
Purchase History
| Date | Buyer | Sale Price | Title Company |
|---|---|---|---|
| Reich Kayla K | -- | None Listed On Document | |
| Klass Family Trust | -- | None Listed On Document | |
| Klass Gregory S | -- | -- | |
| Klass Daniel A | -- | -- | |
| Klass Gregory S | -- | Pacific Title Company | |
| Klass Leah R | -- | Pacific Title Company | |
| Reich Kayla M | -- | Pacific Title Company | |
| Klass Daniel A | -- | Pacific Title Company |
Source: Public Records
Tax History
| Year | Tax Paid | Tax Assessment Tax Assessment Total Assessment is a certain percentage of the fair market value that is determined by local assessors to be the total taxable value of land and additions on the property. | Land | Improvement |
|---|---|---|---|---|
| 2025 | $5,472 | $380,795 | -- | -- |
| 2024 | $5,311 | $369,705 | -- | -- |
| 2023 | $5,154 | $358,938 | $0 | $0 |
| 2022 | $5,014 | $348,485 | $0 | $0 |
| 2021 | $4,907 | $338,336 | $0 | $0 |
| 2020 | $4,793 | $328,482 | $0 | $0 |
| 2019 | $4,662 | $318,915 | $0 | $0 |
Source: Public Records
Map
Nearby Homes
- 908-910 N Franklin St
- 460 10th Ave
- 423 N Downing St
- 1022 N Prom Tradewinds Condo
- 1022 N Prom Tradewinds Condo Unit 208
- 1022 N Promenade Unit 208
- 245 12th Ave
- 460 12th Ave
- 1000 N Holladay Dr Unit 402
- 1000 N Holladay Dr
- 1000 N Holladay Dr Unit 304
- 815 N King St
- 337 16th Ave
- 911 1st Ave
- 1110 6th Ave
- 350 17th Ave
- 26 Avenue A
- 1299 6th Ave
- 361 S Prom Unit 502
- 475 S Prom Unit 518
Your Personal Tour Guide
Ask me questions while you tour the home.