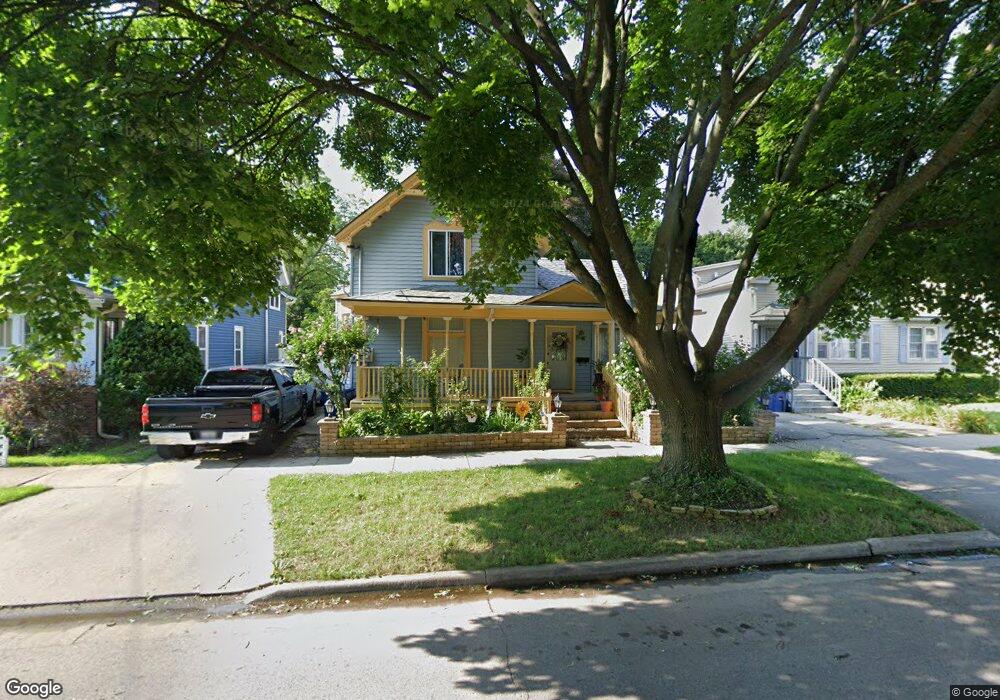
319 Center St Waukegan, IL 60085
Estimated Value: $277,671 - $289,000
4
Beds
3
Baths
2,138
Sq Ft
$134/Sq Ft
Est. Value
About This Home
This home is located at 319 Center St, Waukegan, IL 60085 and is currently estimated at $285,918, approximately $133 per square foot. 319 Center St is a home located in Lake County with nearby schools including Edith M Smith Middle School, Waukegan High School, and LEARN John & Kathy Schreiber Campus.
Ownership History
Date
Name
Owned For
Owner Type
Purchase Details
Closed on
Oct 23, 2001
Sold by
Pasillas Manuel S and Pasillas Maria E
Bought by
Pasillas Manuel S
Current Estimated Value
Home Financials for this Owner
Home Financials are based on the most recent Mortgage that was taken out on this home.
Original Mortgage
$107,500
Interest Rate
6.69%
Create a Home Valuation Report for This Property
The Home Valuation Report is an in-depth analysis detailing your home's value as well as a comparison with similar homes in the area
Home Values in the Area
Average Home Value in this Area
Purchase History
| Date | Buyer | Sale Price | Title Company |
|---|---|---|---|
| Pasillas Manuel S | -- | Brokers Title Insurance Co |
Source: Public Records
Mortgage History
| Date | Status | Borrower | Loan Amount |
|---|---|---|---|
| Closed | Pasillas Manuel S | $107,500 |
Source: Public Records
Tax History Compared to Growth
Tax History
| Year | Tax Paid | Tax Assessment Tax Assessment Total Assessment is a certain percentage of the fair market value that is determined by local assessors to be the total taxable value of land and additions on the property. | Land | Improvement |
|---|---|---|---|---|
| 2024 | $5,192 | $78,858 | $8,599 | $70,259 |
| 2023 | $5,192 | $71,063 | $7,699 | $63,364 |
| 2022 | $1,479 | $65,167 | $7,323 | $57,844 |
| 2021 | $1,578 | $56,150 | $6,532 | $49,618 |
| 2020 | $1,715 | $52,310 | $6,085 | $46,225 |
| 2019 | $1,859 | $47,934 | $5,576 | $42,358 |
| 2018 | $2,080 | $42,583 | $7,104 | $35,479 |
| 2017 | $2,153 | $37,674 | $6,285 | $31,389 |
| 2016 | $2,338 | $32,737 | $5,461 | $27,276 |
| 2015 | $2,556 | $29,300 | $4,888 | $24,412 |
| 2014 | $2,703 | $26,132 | $3,833 | $22,299 |
| 2012 | $4,538 | $28,312 | $4,153 | $24,159 |
Source: Public Records
Map
Nearby Homes
- 723 N County St
- 325 4th St
- 611 N Genesee St
- 415 W Ridgeland Ave
- 452 North Ave
- 217 Stewart Ave
- 918 N Ash St
- 620 N Poplar St
- 702 Franklin St
- 522 N Poplar St
- 222 Grand Ave
- 428 N Poplar St
- 511 Chestnut St
- 1110 N Ash St
- 1122 N Ash St
- 917 N Linden Ave
- 1109 Massena Ave
- 1336 N Ash St
- 1335 Chestnut St
- 28 N Saint James St