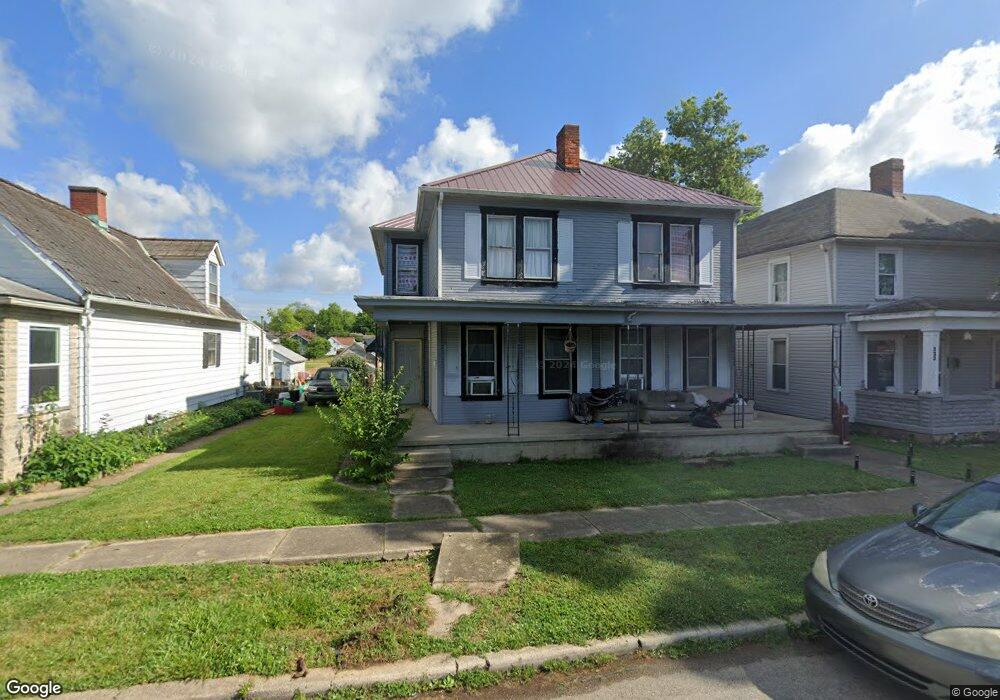
319 Clay St Unit 321 Chillicothe, OH 45601
Estimated Value: $95,000 - $176,000
6
Beds
2
Baths
2,660
Sq Ft
$47/Sq Ft
Est. Value
About This Home
This home is located at 319 Clay St Unit 321, Chillicothe, OH 45601 and is currently estimated at $124,805, approximately $46 per square foot. 319 Clay St Unit 321 is a home located in Ross County with nearby schools including Chillicothe High School, Bishop Flaget School, and Wesley Taylor Preparatory School.
Ownership History
Date
Name
Owned For
Owner Type
Purchase Details
Closed on
Dec 2, 2014
Sold by
Federal Home Loan Mortgage Corporation
Bought by
Sams Everett E
Current Estimated Value
Home Financials for this Owner
Home Financials are based on the most recent Mortgage that was taken out on this home.
Original Mortgage
$13,600
Interest Rate
3.97%
Mortgage Type
Future Advance Clause Open End Mortgage
Purchase Details
Closed on
May 16, 2014
Sold by
Leist Steven D
Bought by
Federal Home Loan Mortgage Corporation
Purchase Details
Closed on
Apr 27, 2007
Sold by
Thompson Glenn and Thompson Carol B
Bought by
Leist Steven D
Home Financials for this Owner
Home Financials are based on the most recent Mortgage that was taken out on this home.
Original Mortgage
$50,400
Interest Rate
6.18%
Mortgage Type
Purchase Money Mortgage
Create a Home Valuation Report for This Property
The Home Valuation Report is an in-depth analysis detailing your home's value as well as a comparison with similar homes in the area
Home Values in the Area
Average Home Value in this Area
Purchase History
| Date | Buyer | Sale Price | Title Company |
|---|---|---|---|
| Sams Everett E | -- | None Available | |
| Federal Home Loan Mortgage Corporation | $24,120 | Attorney | |
| Leist Steven D | $63,000 | Chicago Title Of Ross County |
Source: Public Records
Mortgage History
| Date | Status | Borrower | Loan Amount |
|---|---|---|---|
| Closed | Sams Everett E | $13,600 | |
| Previous Owner | Leist Steven D | $50,400 |
Source: Public Records
Tax History Compared to Growth
Tax History
| Year | Tax Paid | Tax Assessment Tax Assessment Total Assessment is a certain percentage of the fair market value that is determined by local assessors to be the total taxable value of land and additions on the property. | Land | Improvement |
|---|---|---|---|---|
| 2024 | $1,369 | $33,560 | $3,560 | $30,000 |
| 2023 | $1,392 | $33,560 | $3,560 | $30,000 |
| 2022 | $1,394 | $33,560 | $3,560 | $30,000 |
| 2021 | $1,318 | $27,820 | $3,140 | $24,680 |
| 2020 | $1,318 | $27,820 | $3,140 | $24,680 |
| 2019 | $1,319 | $27,820 | $3,140 | $24,680 |
| 2018 | $1,446 | $28,890 | $3,140 | $25,750 |
| 2017 | $1,557 | $28,890 | $3,140 | $25,750 |
| 2016 | $1,542 | $28,890 | $3,140 | $25,750 |
| 2015 | $1,442 | $26,350 | $3,140 | $23,210 |
| 2014 | $1,375 | $26,350 | $3,140 | $23,210 |
| 2013 | $1,377 | $26,350 | $3,140 | $23,210 |
Source: Public Records
Map
Nearby Homes