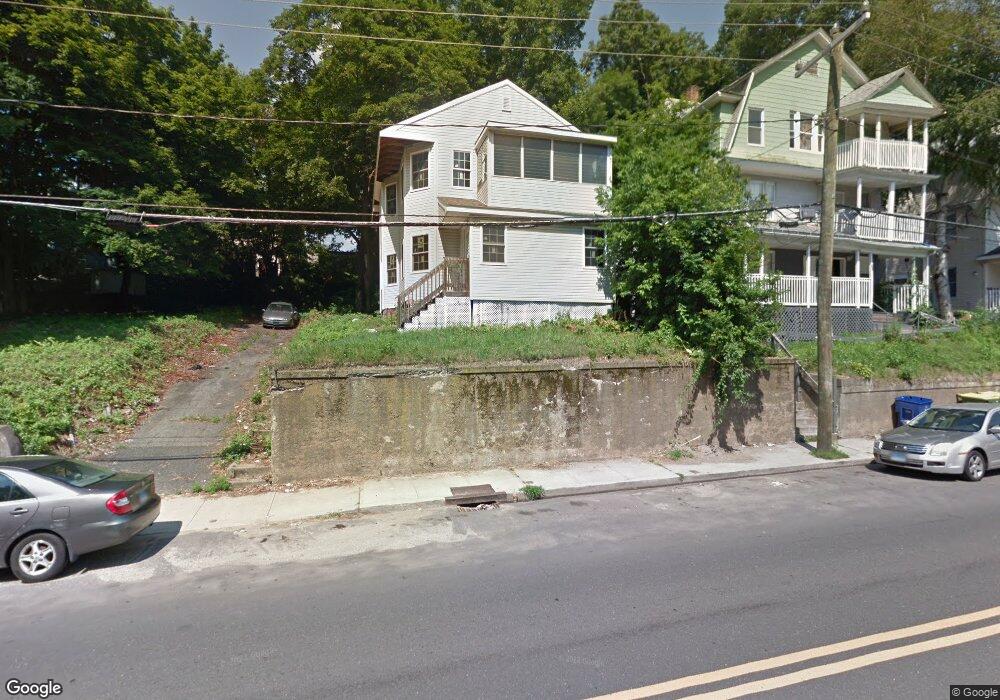
319 Cooke St Waterbury, CT 06710
Village of Waterbury NeighborhoodEstimated Value: $246,332 - $383,000
6
Beds
2
Baths
2,048
Sq Ft
$152/Sq Ft
Est. Value
About This Home
This home is located at 319 Cooke St, Waterbury, CT 06710 and is currently estimated at $310,583, approximately $151 per square foot. 319 Cooke St is a home located in New Haven County with nearby schools including Driggs School, North End Middle School, and Wilby High School.
Ownership History
Date
Name
Owned For
Owner Type
Purchase Details
Closed on
Aug 25, 2011
Sold by
Strulovic Saul
Bought by
Strulovic Leah
Current Estimated Value
Purchase Details
Closed on
Dec 6, 2005
Sold by
Goodson Rita M and Goodson Keith J
Bought by
Steulovic Saul and Steulovic Leah
Home Financials for this Owner
Home Financials are based on the most recent Mortgage that was taken out on this home.
Original Mortgage
$116,000
Interest Rate
6.14%
Mortgage Type
Purchase Money Mortgage
Create a Home Valuation Report for This Property
The Home Valuation Report is an in-depth analysis detailing your home's value as well as a comparison with similar homes in the area
Home Values in the Area
Average Home Value in this Area
Purchase History
| Date | Buyer | Sale Price | Title Company |
|---|---|---|---|
| Strulovic Leah | -- | -- | |
| Steulovic Saul | $196,000 | -- |
Source: Public Records
Mortgage History
| Date | Status | Borrower | Loan Amount |
|---|---|---|---|
| Previous Owner | Steulovic Saul | $116,000 |
Source: Public Records
Tax History Compared to Growth
Tax History
| Year | Tax Paid | Tax Assessment Tax Assessment Total Assessment is a certain percentage of the fair market value that is determined by local assessors to be the total taxable value of land and additions on the property. | Land | Improvement |
|---|---|---|---|---|
| 2025 | $1,785 | $39,690 | $11,200 | $28,490 |
| 2024 | $1,962 | $39,690 | $11,200 | $28,490 |
| 2023 | $2,151 | $39,690 | $11,200 | $28,490 |
| 2022 | $1,544 | $25,650 | $11,210 | $14,440 |
| 2021 | $1,544 | $25,650 | $11,210 | $14,440 |
| 2020 | $1,544 | $25,650 | $11,210 | $14,440 |
| 2019 | $1,544 | $25,650 | $11,210 | $14,440 |
| 2018 | $1,544 | $25,650 | $11,210 | $14,440 |
| 2017 | $1,552 | $25,770 | $11,210 | $14,560 |
| 2016 | $1,552 | $25,770 | $11,210 | $14,560 |
| 2015 | $1,500 | $25,770 | $11,210 | $14,560 |
| 2014 | $1,500 | $25,770 | $11,210 | $14,560 |
Source: Public Records
Map
Nearby Homes