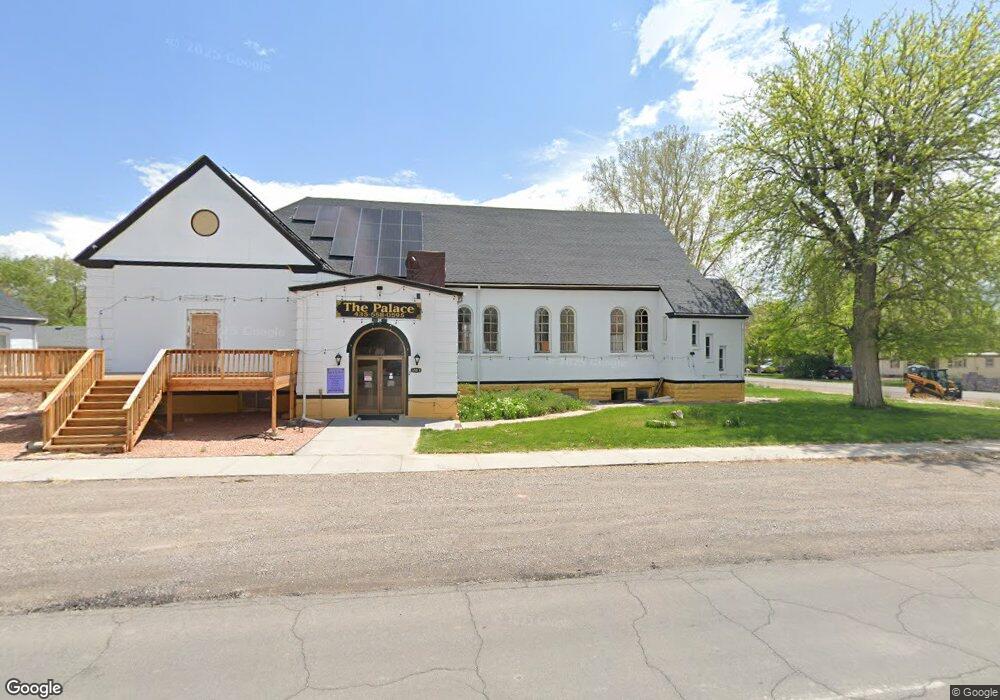
319 E 100 N Richfield, UT 84701
Estimated Value: $290,000 - $347,000
3
Beds
2
Baths
1,296
Sq Ft
$248/Sq Ft
Est. Value
About This Home
This home is located at 319 E 100 N, Richfield, UT 84701 and is currently estimated at $321,839, approximately $248 per square foot. 319 E 100 N is a home located in Sevier County with nearby schools including Ashman School, Pahvant School, and Red Hills Middle School.
Ownership History
Date
Name
Owned For
Owner Type
Purchase Details
Closed on
Dec 16, 2015
Sold by
Oldroyd Audra M
Bought by
Crose Calvin C
Current Estimated Value
Home Financials for this Owner
Home Financials are based on the most recent Mortgage that was taken out on this home.
Original Mortgage
$124,641
Outstanding Balance
$100,295
Interest Rate
3.83%
Mortgage Type
New Conventional
Estimated Equity
$221,544
Purchase Details
Closed on
Jan 12, 2005
Sold by
Oldroyd Audra M
Bought by
Oldroyd William H and Oldroyd Audra M
Create a Home Valuation Report for This Property
The Home Valuation Report is an in-depth analysis detailing your home's value as well as a comparison with similar homes in the area
Home Values in the Area
Average Home Value in this Area
Purchase History
| Date | Buyer | Sale Price | Title Company |
|---|---|---|---|
| Crose Calvin C | -- | First American Title Insuran | |
| Oldroyd William H | -- | None Available |
Source: Public Records
Mortgage History
| Date | Status | Borrower | Loan Amount |
|---|---|---|---|
| Open | Crose Calvin C | $40,000 | |
| Open | Crose Calvin C | $124,641 |
Source: Public Records
Tax History Compared to Growth
Tax History
| Year | Tax Paid | Tax Assessment Tax Assessment Total Assessment is a certain percentage of the fair market value that is determined by local assessors to be the total taxable value of land and additions on the property. | Land | Improvement |
|---|---|---|---|---|
| 2024 | $1,309 | $157,231 | $67,709 | $89,522 |
| 2023 | $1,352 | $146,776 | $44,978 | $101,798 |
| 2022 | $1,326 | $133,643 | $44,491 | $89,152 |
| 2021 | $1,123 | $94,002 | $31,983 | $62,019 |
| 2020 | $1,091 | $85,668 | $24,578 | $61,090 |
| 2019 | $1,022 | $85,670 | $24,580 | $61,090 |
| 2018 | $1,104 | $82,880 | $24,580 | $58,300 |
| 2017 | $1,058 | $75,300 | $20,480 | $54,820 |
| 2016 | $729 | $75,300 | $0 | $0 |
| 2015 | $729 | $72,050 | $0 | $0 |
| 2014 | $729 | $72,060 | $0 | $0 |
Source: Public Records
Map
Nearby Homes
- 347 E 100 N
- 341 E 200 N
- 62 N 200 E
- 227 E 300 N
- 662 E 300 N
- 245 E 300 N
- 135 S 100 E
- 128 W 100 N
- 465 N Main St
- 280 S 100 W
- 712 Crestview Dr
- 165 W 500 N
- 358 W 100 S
- 73 W 500 S Unit 203
- 73 W 500 S Unit 101
- 73 W 500 S Unit 304
- 73 W 500 S Unit 202
- 73 W 500 S Unit 103
- 553 S 100 W Unit 304
- 553 S 100 W Unit 202