Estimated Value: $243,168 - $287,000
3
Beds
1
Bath
1,536
Sq Ft
$173/Sq Ft
Est. Value
About This Home
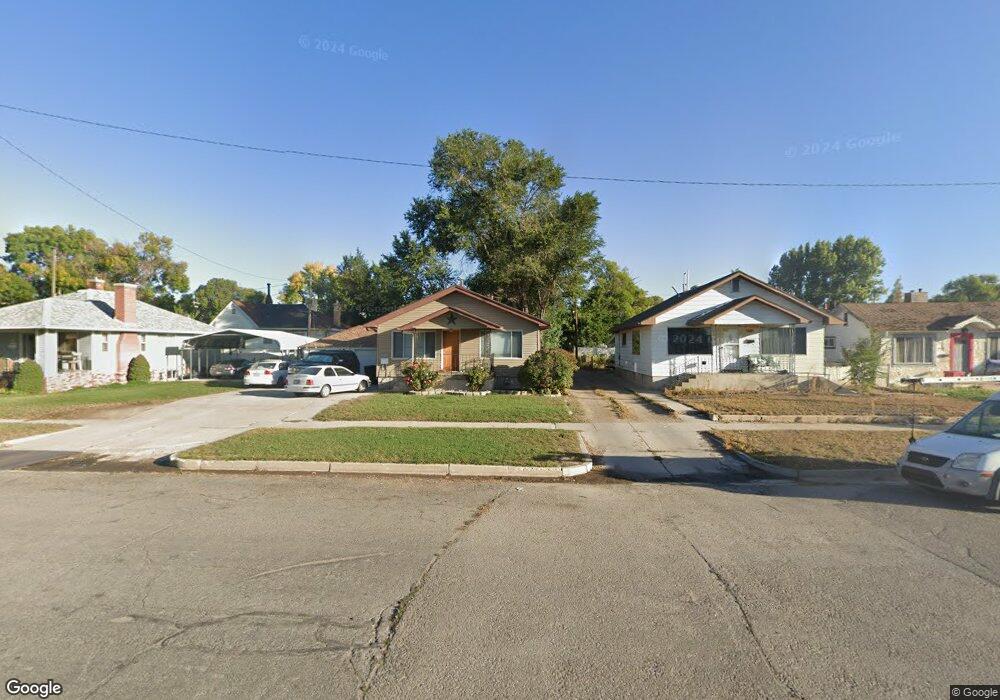
This home is located at 319 E 200 N, Price, UT 84501 and is currently estimated at $265,084, approximately $172 per square foot. 319 E 200 N is a home located in Carbon County with nearby schools including Castle Heights School, Mont Harmon Junior High School, and Carbon High School.
Ownership History
Date
Name
Owned For
Owner Type
Purchase Details
Closed on
May 8, 2024
Sold by
Four Corners Community Behavioral Health
Bought by
Allred Linda J and Allred Bryon F
Current Estimated Value
Purchase Details
Closed on
Sep 1, 2020
Sold by
Swenson David C and Swenson Melissa A
Bought by
Four Corners Cmnty Behavioral Health Inc
Purchase Details
Closed on
Mar 4, 2011
Sold by
Christensen Michael W
Bought by
Swenson David C and Swenson Melissa A
Purchase Details
Closed on
Jan 26, 2007
Sold by
Wilcox Colton R
Bought by
Christensen Michael W
Home Financials for this Owner
Home Financials are based on the most recent Mortgage that was taken out on this home.
Original Mortgage
$64,424
Interest Rate
6.1%
Mortgage Type
FHA
Create a Home Valuation Report for This Property
The Home Valuation Report is an in-depth analysis detailing your home's value as well as a comparison with similar homes in the area
Home Values in the Area
Average Home Value in this Area
Purchase History
| Date | Buyer | Sale Price | Title Company |
|---|---|---|---|
| Allred Linda J | -- | Professional Title Services | |
| Four Corners Cmnty Behavioral Health Inc | -- | Professional Title Services | |
| Swenson David C | -- | -- | |
| Christensen Michael W | -- | South Eastern Utah Title Co |
Source: Public Records
Mortgage History
| Date | Status | Borrower | Loan Amount |
|---|---|---|---|
| Previous Owner | Christensen Michael W | $64,424 |
Source: Public Records
Tax History Compared to Growth
Tax History
| Year | Tax Paid | Tax Assessment Tax Assessment Total Assessment is a certain percentage of the fair market value that is determined by local assessors to be the total taxable value of land and additions on the property. | Land | Improvement |
|---|---|---|---|---|
| 2025 | $1,096 | $90,199 | $4,772 | $85,427 |
| 2024 | $362 | $0 | $0 | $0 |
| 2023 | $727 | $0 | $0 | $0 |
| 2022 | $751 | $0 | $0 | $0 |
| 2021 | $654 | $80,833 | $14,459 | $66,374 |
| 2020 | $644 | $39,961 | $0 | $0 |
| 2019 | $577 | $37,551 | $0 | $0 |
| 2018 | $535 | $35,532 | $0 | $0 |
| 2017 | $529 | $35,532 | $0 | $0 |
| 2016 | $477 | $35,532 | $0 | $0 |
| 2015 | $477 | $35,532 | $0 | $0 |
| 2014 | $474 | $35,532 | $0 | $0 |
| 2013 | $358 | $26,622 | $0 | $0 |
Source: Public Records
Map
Nearby Homes