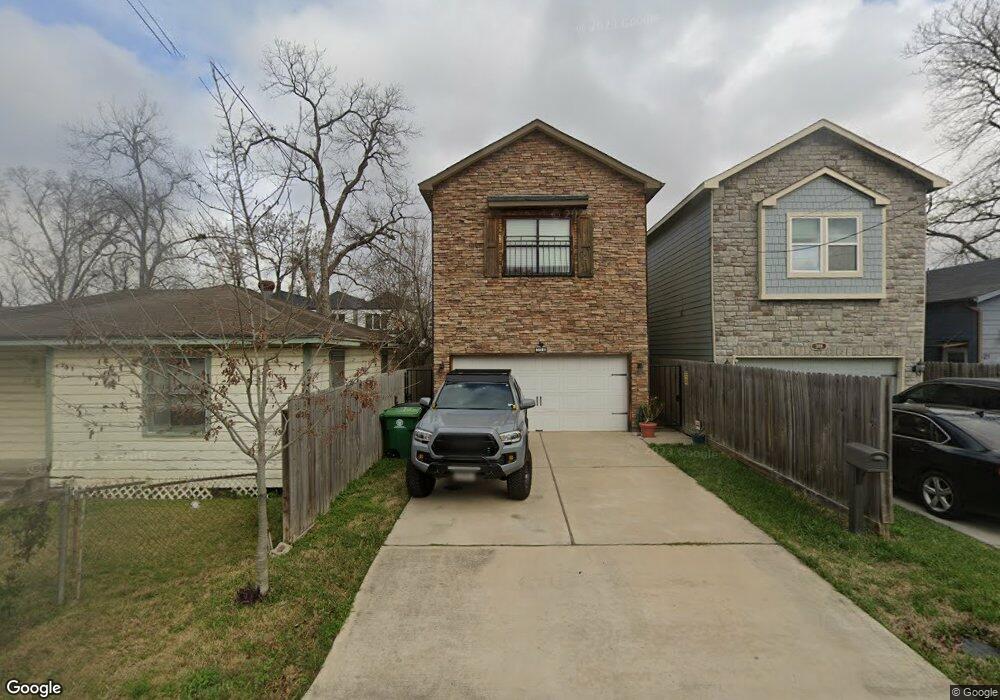
319 E 39th St Unit A Houston, TX 77018
Independence Heights NeighborhoodEstimated Value: $464,000
3
Beds
3
Baths
2,032
Sq Ft
$228/Sq Ft
Est. Value
About This Home
This home is located at 319 E 39th St Unit A, Houston, TX 77018 and is currently estimated at $464,000, approximately $228 per square foot. 319 E 39th St Unit A is a home located in Harris County with nearby schools including Burrus Elementary School, Williams Middle, and Booker T Washington Sr High.
Ownership History
Date
Name
Owned For
Owner Type
Purchase Details
Closed on
Jan 27, 2017
Sold by
Angelichomes Com1 Llc
Bought by
Rodiek Bianca
Current Estimated Value
Home Financials for this Owner
Home Financials are based on the most recent Mortgage that was taken out on this home.
Original Mortgage
$236,800
Outstanding Balance
$195,841
Interest Rate
4.16%
Mortgage Type
New Conventional
Estimated Equity
$268,159
Purchase Details
Closed on
May 21, 2015
Sold by
Periwinkle Properties Llc
Bought by
Angelichomes Com1 Llc
Purchase Details
Closed on
Oct 7, 2014
Sold by
Baldwin Lella and Harris County
Bought by
Periwinkle Properties Llc
Purchase Details
Closed on
Aug 19, 2014
Sold by
Bourgeois Waltine M and Mosie Andrea B
Bought by
Houston Independent School District and Harris County
Create a Home Valuation Report for This Property
The Home Valuation Report is an in-depth analysis detailing your home's value as well as a comparison with similar homes in the area
Home Values in the Area
Average Home Value in this Area
Purchase History
| Date | Buyer | Sale Price | Title Company |
|---|---|---|---|
| Rodiek Bianca | -- | None Available | |
| Angelichomes Com1 Llc | -- | South Land Title Llc | |
| Periwinkle Properties Llc | $27,000 | None Available | |
| Houston Independent School District | -- | -- | |
| Houston Independent School District | -- | -- |
Source: Public Records
Mortgage History
| Date | Status | Borrower | Loan Amount |
|---|---|---|---|
| Open | Rodiek Bianca | $236,800 |
Source: Public Records
Tax History Compared to Growth
Tax History
| Year | Tax Paid | Tax Assessment Tax Assessment Total Assessment is a certain percentage of the fair market value that is determined by local assessors to be the total taxable value of land and additions on the property. | Land | Improvement |
|---|---|---|---|---|
| 2025 | $6,328 | $422,491 | $84,000 | $338,491 |
| 2024 | $6,328 | $429,182 | $84,000 | $345,182 |
| 2023 | $6,328 | $416,606 | $84,000 | $332,606 |
| 2022 | $8,080 | $373,238 | $72,000 | $301,238 |
| 2021 | $7,775 | $333,615 | $60,000 | $273,615 |
| 2020 | $7,500 | $309,726 | $60,000 | $249,726 |
| 2019 | $8,239 | $360,798 | $52,500 | $308,298 |
| 2018 | $5,720 | $296,000 | $45,000 | $251,000 |
| 2017 | $7,485 | $335,940 | $36,000 | $299,940 |
| 2016 | $6,925 | $273,875 | $36,000 | $237,875 |
| 2015 | -- | $36,000 | $36,000 | $0 |
| 2014 | -- | $30,500 | $30,000 | $500 |
Source: Public Records
Map
Nearby Homes