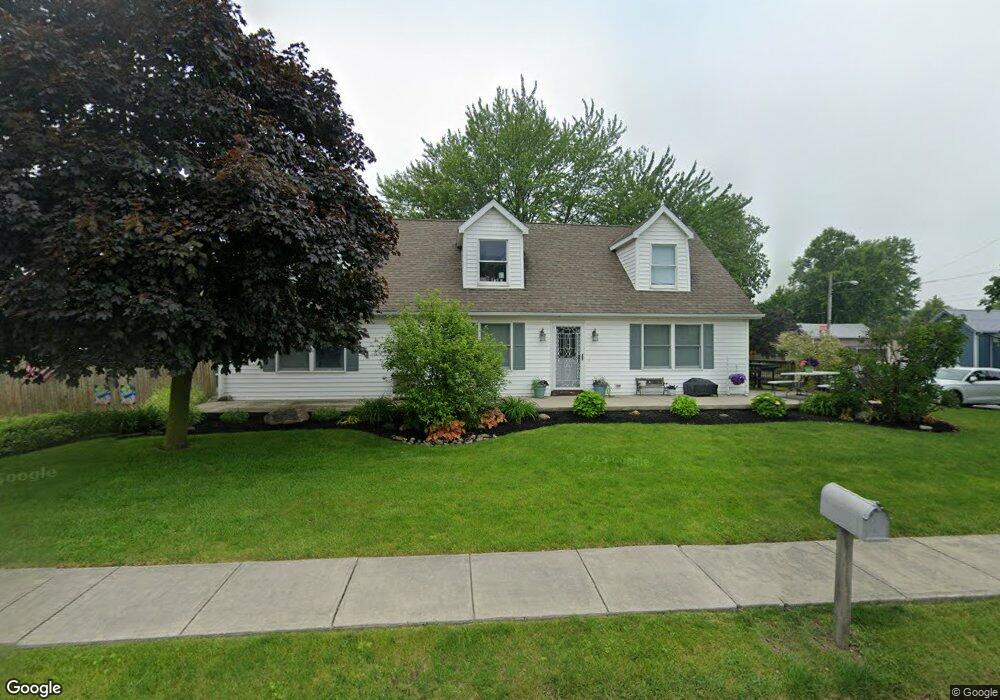
319 E South St Mc Comb, OH 45858
McComb NeighborhoodEstimated Value: $170,000 - $206,000
5
Beds
2
Baths
1,820
Sq Ft
$107/Sq Ft
Est. Value
About This Home
This home is located at 319 E South St, Mc Comb, OH 45858 and is currently estimated at $195,248, approximately $107 per square foot. 319 E South St is a home located in Hancock County with nearby schools including McComb Elementary School, McComb Middle School, and Mccomb Local High School.
Ownership History
Date
Name
Owned For
Owner Type
Purchase Details
Closed on
Aug 18, 2011
Sold by
Secretary Of Hud
Bought by
Griffith Jeffrey S
Current Estimated Value
Home Financials for this Owner
Home Financials are based on the most recent Mortgage that was taken out on this home.
Original Mortgage
$101,011
Outstanding Balance
$70,908
Interest Rate
4.87%
Mortgage Type
FHA
Estimated Equity
$124,340
Purchase Details
Closed on
Dec 2, 2010
Sold by
Midfirst Bank
Bought by
Secretary Of Housing & Urban Development
Purchase Details
Closed on
Nov 29, 2010
Sold by
Hartzler Daniel D
Bought by
Midfirst Bank
Purchase Details
Closed on
Apr 27, 1994
Bought by
Myers John and Myers Andrea K
Purchase Details
Closed on
Feb 15, 1994
Bought by
Myers Andrea K
Create a Home Valuation Report for This Property
The Home Valuation Report is an in-depth analysis detailing your home's value as well as a comparison with similar homes in the area
Home Values in the Area
Average Home Value in this Area
Purchase History
| Date | Buyer | Sale Price | Title Company |
|---|---|---|---|
| Griffith Jeffrey S | $80,000 | Whitman Title | |
| Secretary Of Housing & Urban Development | -- | None Available | |
| Midfirst Bank | $148,341 | None Available | |
| Myers John | -- | -- | |
| Myers Andrea K | -- | -- |
Source: Public Records
Mortgage History
| Date | Status | Borrower | Loan Amount |
|---|---|---|---|
| Open | Griffith Jeffrey S | $101,011 |
Source: Public Records
Tax History
| Year | Tax Paid | Tax Assessment Tax Assessment Total Assessment is a certain percentage of the fair market value that is determined by local assessors to be the total taxable value of land and additions on the property. | Land | Improvement |
|---|---|---|---|---|
| 2024 | $1,975 | $58,160 | $3,430 | $54,730 |
| 2023 | $1,963 | $58,160 | $3,430 | $54,730 |
| 2022 | $2,335 | $58,160 | $3,430 | $54,730 |
| 2021 | $2,400 | $51,910 | $3,430 | $48,480 |
| 2020 | $2,021 | $51,910 | $3,430 | $48,480 |
| 2019 | $2,214 | $51,910 | $3,430 | $48,480 |
| 2018 | $2,076 | $50,930 | $2,450 | $48,480 |
| 2017 | $1,044 | $50,930 | $2,450 | $48,480 |
| 2016 | $1,909 | $50,930 | $2,450 | $48,480 |
| 2015 | $1,623 | $41,800 | $2,800 | $39,000 |
| 2014 | $1,624 | $41,570 | $2,800 | $38,770 |
| 2012 | $2,044 | $49,510 | $2,800 | $46,710 |
Source: Public Records
Map
Nearby Homes
- 257 S Main St
- 0 Joshua Rd Unit 6126475
- 4609 Township Road 235
- 223 Cherry St
- 4134 County Road 203
- 358 State Route 613
- 7780 Township Road 89
- 1128 County Road 139
- 0 Rock Candy Rd Unit Lot 159
- 0 Rock Candy Rd Unit Lot 170
- 0 Rock Candy Rd Unit Lot 172 206819
- 0 Rock Candy Rd Unit Lot 162
- 0 Rock Candy Rd Unit Lot 171
- 0 Rock Candy Rd Unit Lot 168
- 9894 Smokies Way
- 0 Rock Candy Rd Or Bushwillow Dr Unit Lot 173
- 0 Bearcat Way Or Rock Candy Rd Unit Lot 167
- 0 Bushwillow Dr Or Rock Candy Rd Unit Lot 157
- 1280 Ohio 613
- 0 County Road 95 Unit 6097574
- 315 E South St
- 311 E South St
- 307 E South St
- 324 E South St
- 316 E South St
- 324 Bond Preble St
- 303 E South St
- 312 E South St
- 312 Bond Preble St
- 316 Bond Preble St
- 311 Bond Preble St
- 315 Bond Preble St
- 315 Bond-Preble St
- 304 E South St
- 287 E South St
- 216 Cora St
- 108 Cora St
- 208 Park Dr N
- 208 Park Dr S
- 281 E South St
Your Personal Tour Guide
Ask me questions while you tour the home.