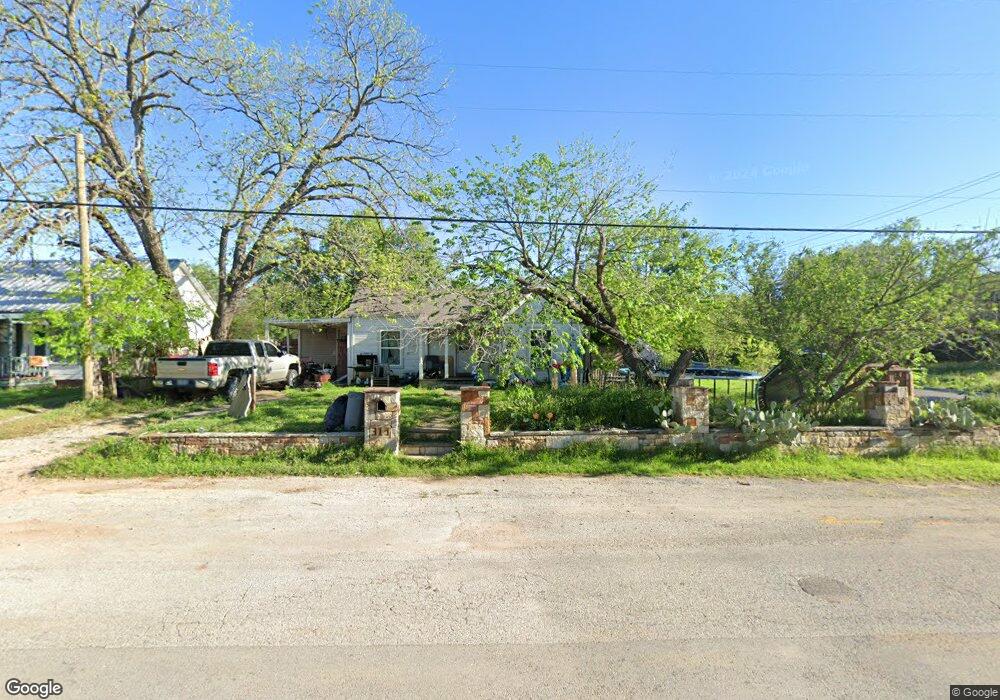
319 Edna St Weatherford, TX 76086
Estimated Value: $151,448 - $203,000
--
Bed
--
Bath
752
Sq Ft
$231/Sq Ft
Est. Value
About This Home
This home is located at 319 Edna St, Weatherford, TX 76086 and is currently estimated at $173,612, approximately $230 per square foot. 319 Edna St is a home located in Parker County with nearby schools including Seguin Elementary School, Tison Middle School, and Weatherford High School.
Ownership History
Date
Name
Owned For
Owner Type
Purchase Details
Closed on
Mar 4, 2015
Sold by
Gebbie Arthur & Marilyn Rev Liv Trust
Bought by
Gebbie Revocable Living Trust
Current Estimated Value
Home Financials for this Owner
Home Financials are based on the most recent Mortgage that was taken out on this home.
Original Mortgage
$120,000
Outstanding Balance
$91,840
Interest Rate
3.66%
Mortgage Type
New Conventional
Estimated Equity
$81,772
Purchase Details
Closed on
Jan 14, 2004
Sold by
Gebbie Arthur
Bought by
Gebbie Revocable Living Trust
Create a Home Valuation Report for This Property
The Home Valuation Report is an in-depth analysis detailing your home's value as well as a comparison with similar homes in the area
Home Values in the Area
Average Home Value in this Area
Purchase History
| Date | Buyer | Sale Price | Title Company |
|---|---|---|---|
| Gebbie Revocable Living Trust | -- | -- | |
| Erath Capital Investments Llc | -- | Stewart | |
| Gebbie Revocable Living Trust | -- | -- |
Source: Public Records
Mortgage History
| Date | Status | Borrower | Loan Amount |
|---|---|---|---|
| Open | Erath Capital Investments Llc | $120,000 |
Source: Public Records
Tax History Compared to Growth
Tax History
| Year | Tax Paid | Tax Assessment Tax Assessment Total Assessment is a certain percentage of the fair market value that is determined by local assessors to be the total taxable value of land and additions on the property. | Land | Improvement |
|---|---|---|---|---|
| 2025 | -- | $154,390 | $50,000 | $104,390 |
| 2024 | -- | $138,380 | $40,000 | $98,380 |
| 2023 | $2,658 | $138,380 | $40,000 | $98,380 |
| 2022 | $1,405 | $63,330 | $15,000 | $48,330 |
| 2021 | $1,521 | $63,330 | $15,000 | $48,330 |
| 2020 | $1,365 | $56,510 | $15,000 | $41,510 |
| 2019 | $1,443 | $56,510 | $15,000 | $41,510 |
| 2018 | $1,289 | $50,260 | $15,000 | $35,260 |
| 2017 | $1,322 | $50,260 | $15,000 | $35,260 |
| 2016 | $1,121 | $42,610 | $15,000 | $27,610 |
| 2015 | $1,098 | $42,610 | $15,000 | $27,610 |
| 2014 | $1,011 | $40,240 | $15,000 | $25,240 |
Source: Public Records
Map
Nearby Homes