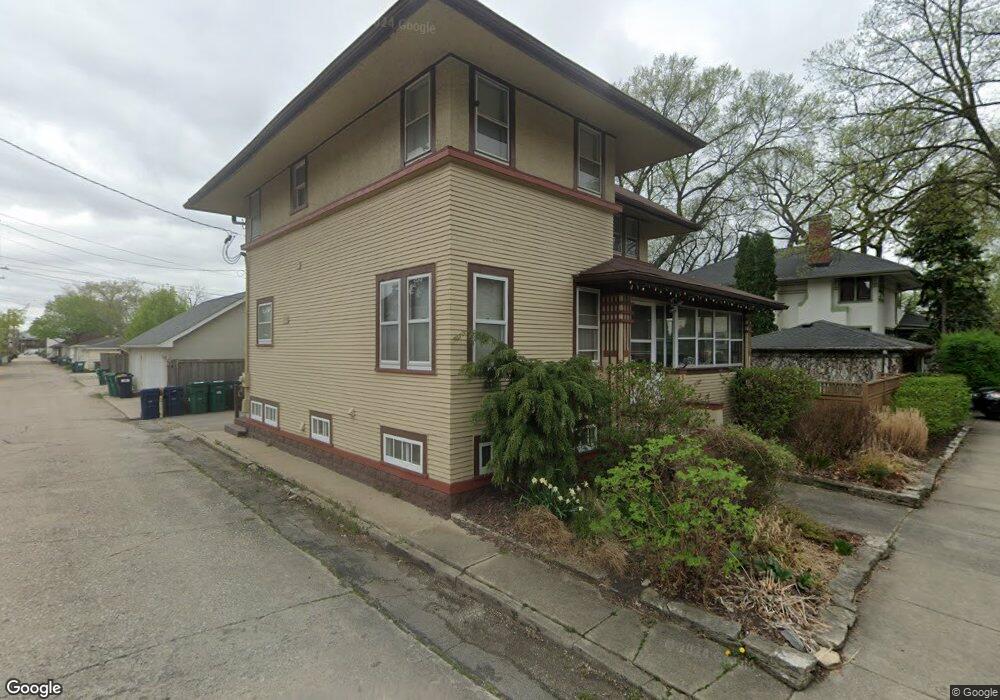
319 Erie St Oak Park, IL 60302
Estimated Value: $622,248 - $1,233,000
4
Beds
2
Baths
1,789
Sq Ft
$462/Sq Ft
Est. Value
About This Home
This home is located at 319 Erie St, Oak Park, IL 60302 and is currently estimated at $826,562, approximately $462 per square foot. 319 Erie St is a home located in Cook County with nearby schools including William Beye Elementary School, Percy Julian Middle School, and Oak Park and River Forest High School.
Ownership History
Date
Name
Owned For
Owner Type
Purchase Details
Closed on
Sep 30, 2015
Sold by
Weeks Kyle A and Weeks Deborah K
Bought by
Kyle Weeks & Deborah Weeks Revocable Tru
Current Estimated Value
Purchase Details
Closed on
Jun 28, 2004
Sold by
319 W Erie Llc
Bought by
Amalgamated Bank Of Chicago and Trust #5953
Home Financials for this Owner
Home Financials are based on the most recent Mortgage that was taken out on this home.
Original Mortgage
$4,840,000
Interest Rate
4%
Mortgage Type
Credit Line Revolving
Purchase Details
Closed on
May 9, 2001
Sold by
Oconnell Sean M and Oconnell Kathleen K
Bought by
Weeks Kyle A and Weeks Deborah K
Home Financials for this Owner
Home Financials are based on the most recent Mortgage that was taken out on this home.
Original Mortgage
$260,000
Interest Rate
7.02%
Purchase Details
Closed on
Jun 26, 1998
Sold by
Bligh Sarah Blair
Bought by
Oconnell Sean M and Oconnell Kathleen K
Create a Home Valuation Report for This Property
The Home Valuation Report is an in-depth analysis detailing your home's value as well as a comparison with similar homes in the area
Home Values in the Area
Average Home Value in this Area
Purchase History
| Date | Buyer | Sale Price | Title Company |
|---|---|---|---|
| Kyle Weeks & Deborah Weeks Revocable Tru | -- | Attorney | |
| Amalgamated Bank Of Chicago | -- | Cti | |
| Weeks Kyle A | -- | -- | |
| Weeks Kyle A | $335,000 | -- | |
| Oconnell Sean M | $230,000 | -- |
Source: Public Records
Mortgage History
| Date | Status | Borrower | Loan Amount |
|---|---|---|---|
| Closed | Amalgamated Bank Of Chicago | $4,840,000 | |
| Previous Owner | Weeks Kyle A | $260,000 |
Source: Public Records
Tax History Compared to Growth
Tax History
| Year | Tax Paid | Tax Assessment Tax Assessment Total Assessment is a certain percentage of the fair market value that is determined by local assessors to be the total taxable value of land and additions on the property. | Land | Improvement |
|---|---|---|---|---|
| 2024 | $14,432 | $43,725 | $5,208 | $38,517 |
| 2023 | $11,351 | $47,586 | $5,208 | $42,378 |
| 2022 | $11,351 | $32,982 | $3,534 | $29,448 |
| 2021 | $11,677 | $34,537 | $3,534 | $31,003 |
| 2020 | $12,474 | $37,273 | $3,534 | $33,739 |
| 2019 | $11,489 | $33,375 | $2,604 | $30,771 |
| 2018 | $12,688 | $37,794 | $2,604 | $35,190 |
| 2017 | $12,431 | $37,794 | $2,604 | $35,190 |
| 2016 | $10,879 | $29,528 | $2,604 | $26,924 |
| 2015 | $8,996 | $27,569 | $2,604 | $24,965 |
| 2014 | $10,470 | $33,814 | $2,604 | $31,210 |
| 2013 | $10,182 | $33,917 | $5,007 | $28,910 |
Source: Public Records
Map
Nearby Homes
- 330 N Ridgeland Ave
- 217 Chicago Ave Unit 3
- 519 N Elmwood Ave
- 143 N Taylor Ave
- 120 Chicago Ave Unit A
- 307 South Blvd
- 255 South Blvd Unit 7
- 406 Linden Ave
- 1407 A N Harlem Ave
- 138 Frank Lloyd Wright Ln
- 126 N Taylor Ave Unit 1S
- 403 N Humphrey Ave
- 108 S Scoville Ave Unit 2C
- 62 Chicago Ave
- 538 N East Ave
- 108 Bishop Quarter Ln
- 140 N Euclid Ave Unit 507
- 719 Erie St Unit 3A
- 212 N Oak Park Ave Unit 2EE
- 125 N Euclid Ave Unit 305
- 232 N Ridgeland Ave
- 226 N Ridgeland Ave
- 229 N Cuyler Ave
- 222 N Ridgeland Ave
- 225 N Cuyler Ave
- 303 N Cuyler Ave
- 221 N Cuyler Ave
- 216 N Ridgeland Ave
- 305 N Cuyler Ave Unit 3401A
- 308 N Ridgeland Ave
- 217 N Cuyler Ave
- 307 N Cuyler Ave
- 212 N Ridgeland Ave
- 312 N Ridgeland Ave
- 311 N Cuyler Ave
- 213 N Cuyler Ave
- 208 N Ridgeland Ave
- 315 N Cuyler Ave
- 233 N Ridgeland Ave
- 229 N Ridgeland Ave